Back chapter figures
Figure 10.6
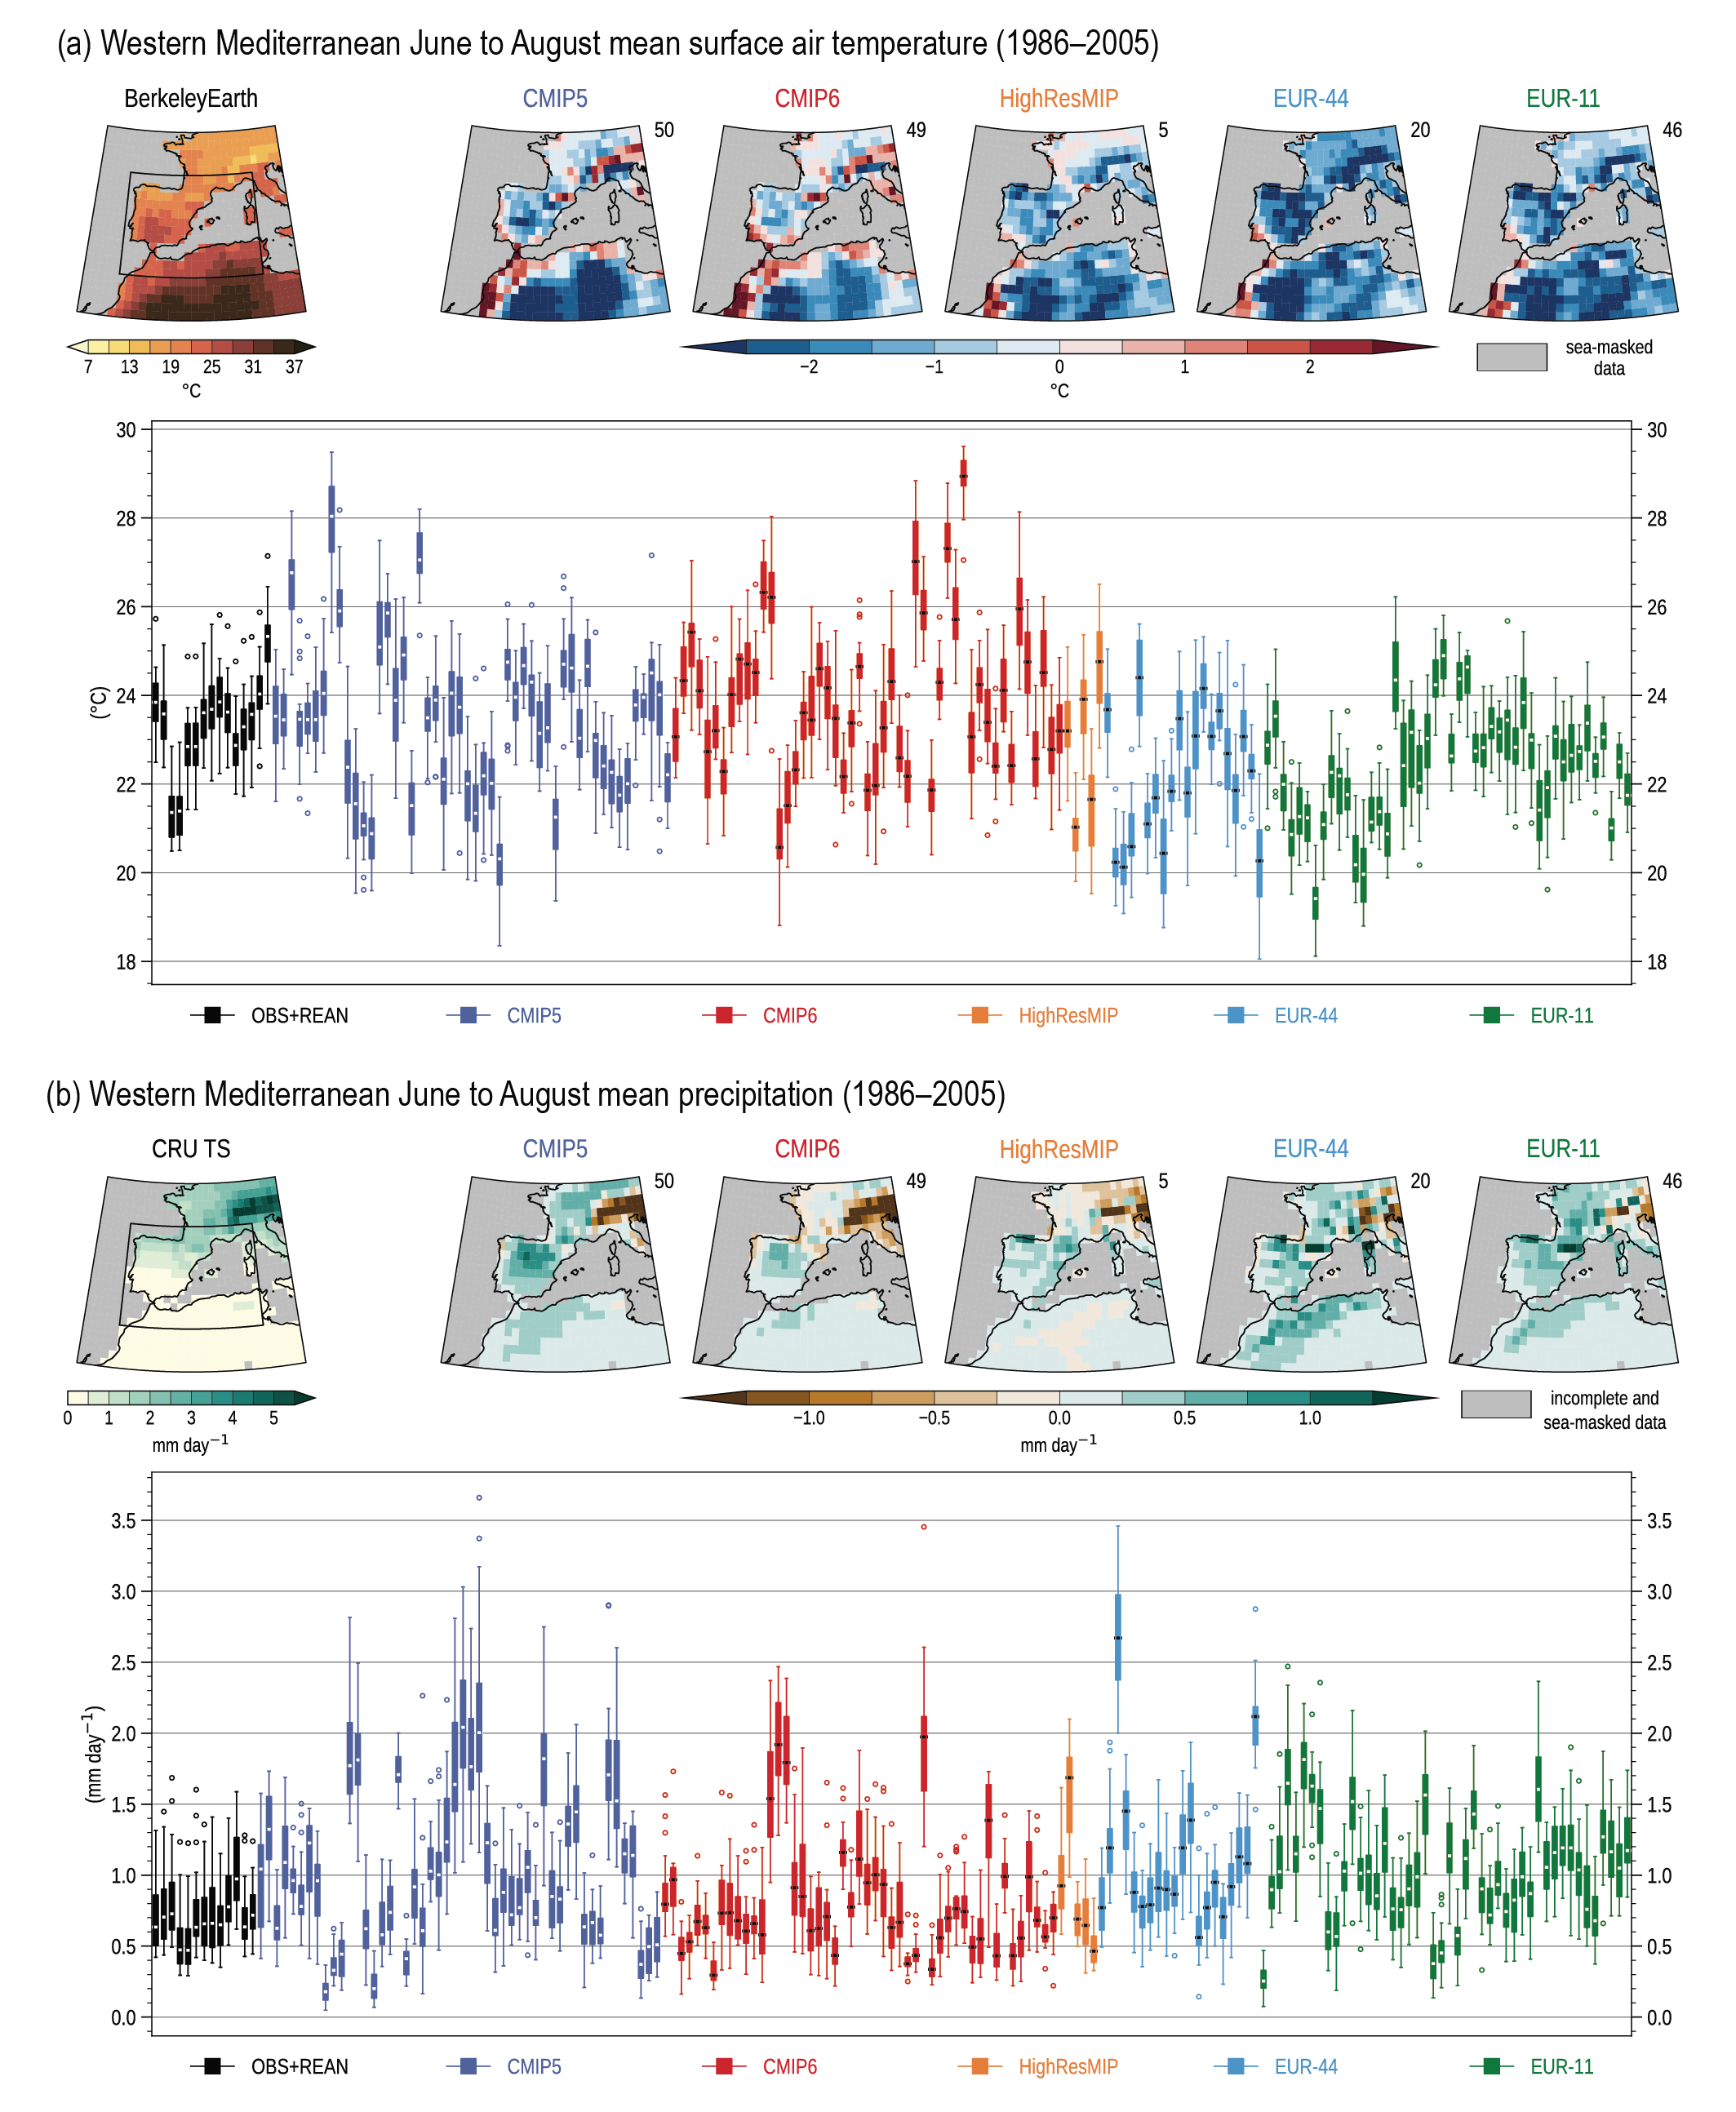
Figure caption
Figure 10.6 | Illustration of some model biases in simulations performed with dynamical models. Top row: Mean summer (June to August) near-surface air temperature (in °C) over the Mediterranean area in Berkeley Earth and respective mean bias for five multi-model historical experiments with global models (CMIP5, CMIP6 and HighResMIP) and regional climate models (CORDEX EUR-44 and EUR-11) averaged between 1986–2005. Bottom row: Box-and-whisker plot shows spread of the 20 annual mean summer surface air temperature averaged over land areas in the western Mediterranean region (33°N–45°N, 10°W–10°E, black quadrilateral in the first panel of the top row) for a set of references and single model runs of the five multi-model experiments (one simulation per model) between 1986–2005. Additional observation and reanalysis data included in the bottom row are CRU TS, HadCRUT4, HadCRUT5, E-OBS, WFDE5, ERA5, ERA-Interim, CERA-20C, JRA-25, JRA-55, CFSR, MERRA2, MERRA. Berkeley Earth is shown in the first box to the left. (b) As (a) but for precipitation rate (mm day–1) and showing CRU TS in the first panel of the top row. Biases of the five multi-model experiments are shown with respect to CRU TS. Additional observation and reanalysis data included in the bottom row are GPCC, REGEN, E-OBS, GHCN, WFDE5, CFSR, ERA-Interim, ERA5, JRA-55, MERRA2, MERRA. CRU TS is shown in the first box to the left. All box-and-whisker plots show the median (line), and the interquartile range (IQR = Q3–Q1, box), with top whiskers extending to the last data less than Q3 + 1.5 × IQR and analogously for bottom whiskers. Data outside the whiskers range appear as flyers (circles). Further details on data sources and processing are available in the chapter data table (Table 10.SM.11).