Back chapter figures
Figure 10.8
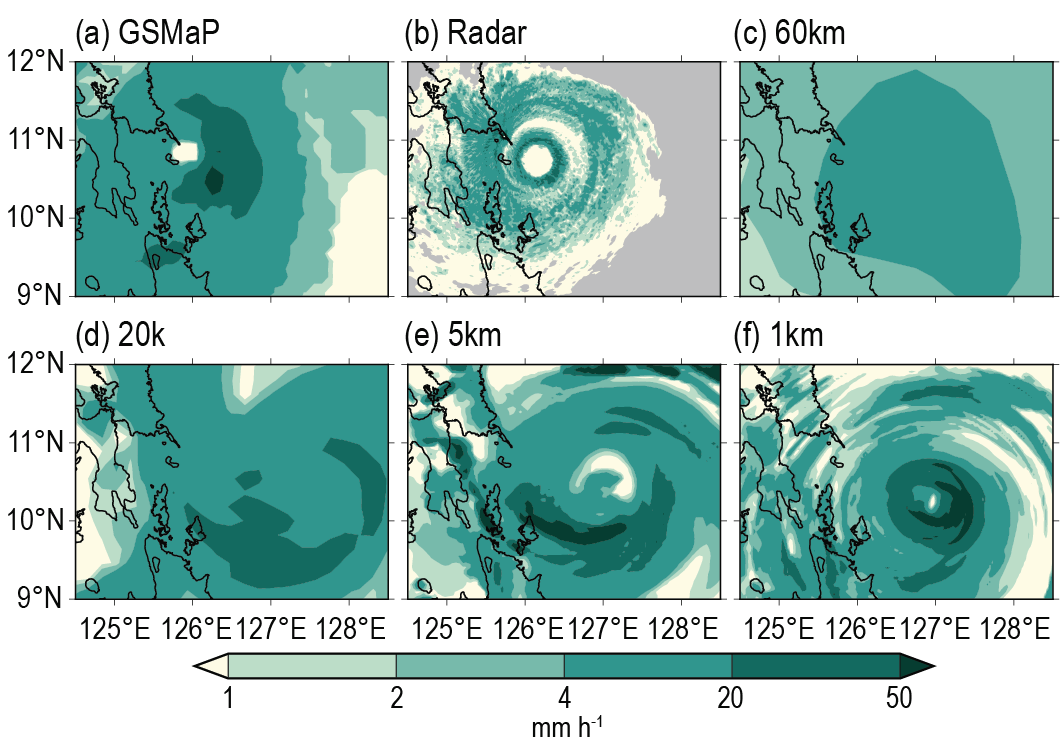
Figure caption
Figure 10.8 | Hourly accumulated precipitation profiles (mm hour–1) around the eye of Typhoon Haiyan. Represented by (a) Global Satellite Mapping of Precipitation (GSMaP) data (multi-satellite observation), (b) Guiuan radar (PAGASA), (c) Weekly Ensemble Prediction System (WEPS) data (JMA; 60 km), (d) NHRCM (20 km), (e) NHRCM (5 km), and (f) WRF (1 km) models. Panels (b), (d–f) are adapted from Takayabu et al. (2015), CCBY3.0https://creativecommons.org/licenses/by/3.0. Further details on data sources and processing are available in the chapter data table (Table 10.SM.11).