Back chapter figures
Figure 10.9
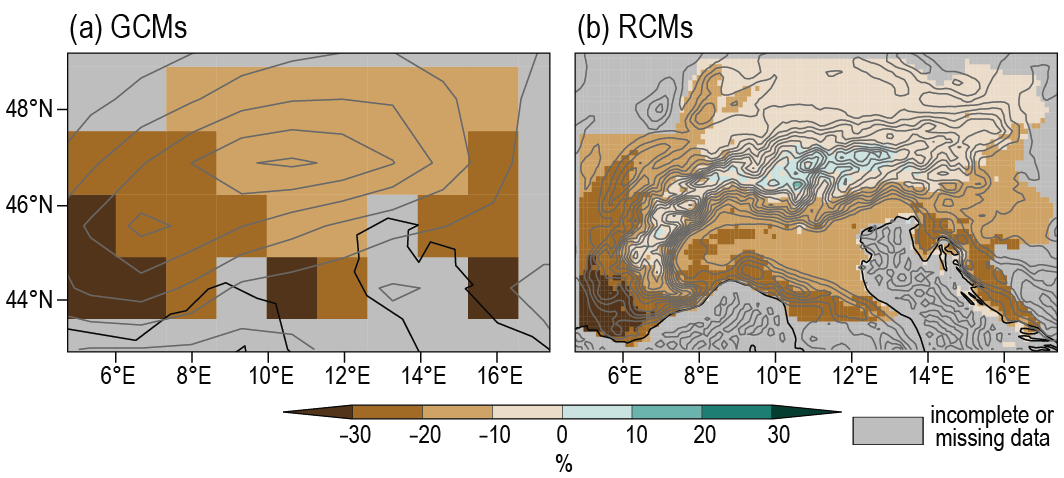
Figure caption
Figure 10. 9 | Projected changes in summer (June to August) precipitation (in percent with respect to the mean precipitation) over the Alps between the periods 2070–2099 and 1975–2004. (a) Mean of four global climate models (GCMs) regridded to a common 1.32° × 1.32° grid resolution; (b) mean of six regional climate models (RCMs) driven with these GCMs. The grey isolines show elevation at 200 m intervals of the underlying model data. Further details on data sources and processing are available in the chapter data table (Table 10.SM.11). Figure adapted from Giorgi et al. (2016).