Box 11.1 Figure 1
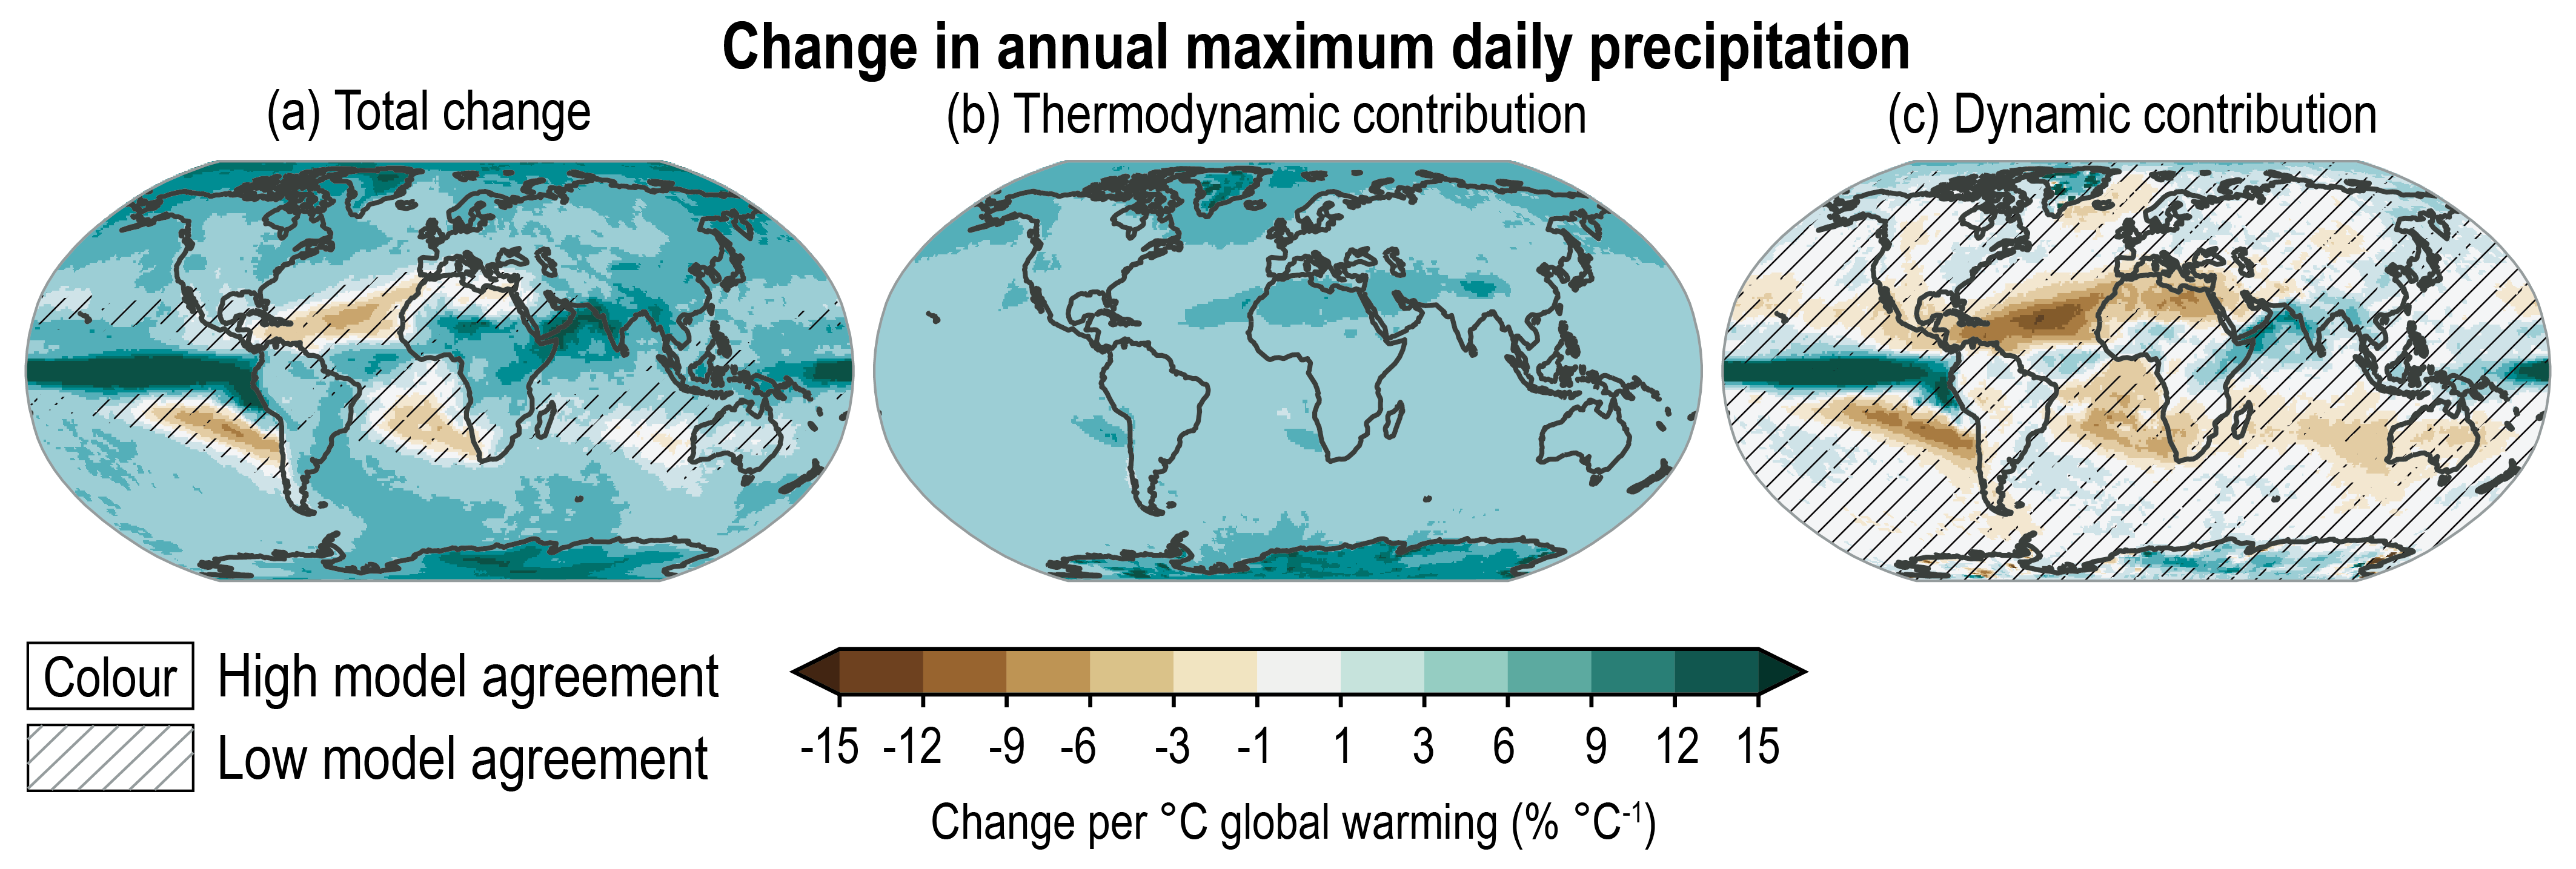
Figure caption
Box 11.1, Figure 1: Multi-model Coupled Model Intercomparison Project Phase 5 (CMIP5) mean fractional changes (in % per degree of warming). (a) changes in annual maximum precipitation (Rx1day); (b) changes in Rx1day due to the thermodynamic contribution; and (c) changes in Rx1day due to the dynamic contribution estimated as the difference between the total changes and the thermodynamic contribution. Changes were derived from a linear regression for the period 1950–2100. Uncertainty is represented using the simple approach: no overlay indicates regions with high model agreement, where ≥80% of models (n=22) agree on the sign of change; diagonal lines indicate regions with low model agreement, where <80% of models agree on the sign of change. For more information on the simple approach, please refer to the Cross-Chapter Box Atlas 1. A detailed description of the estimation of dynamic and thermodynamic contributions is given in Pfahl et al. (2017). Figure adapted from Pfahl et al. (2017), originally published inNature Climate Change/Springer Nature. Further details on data sources and processing are available in the chapter data table (Table 11.SM.9).