Back chapter figures
Box 11.4 Figure 2
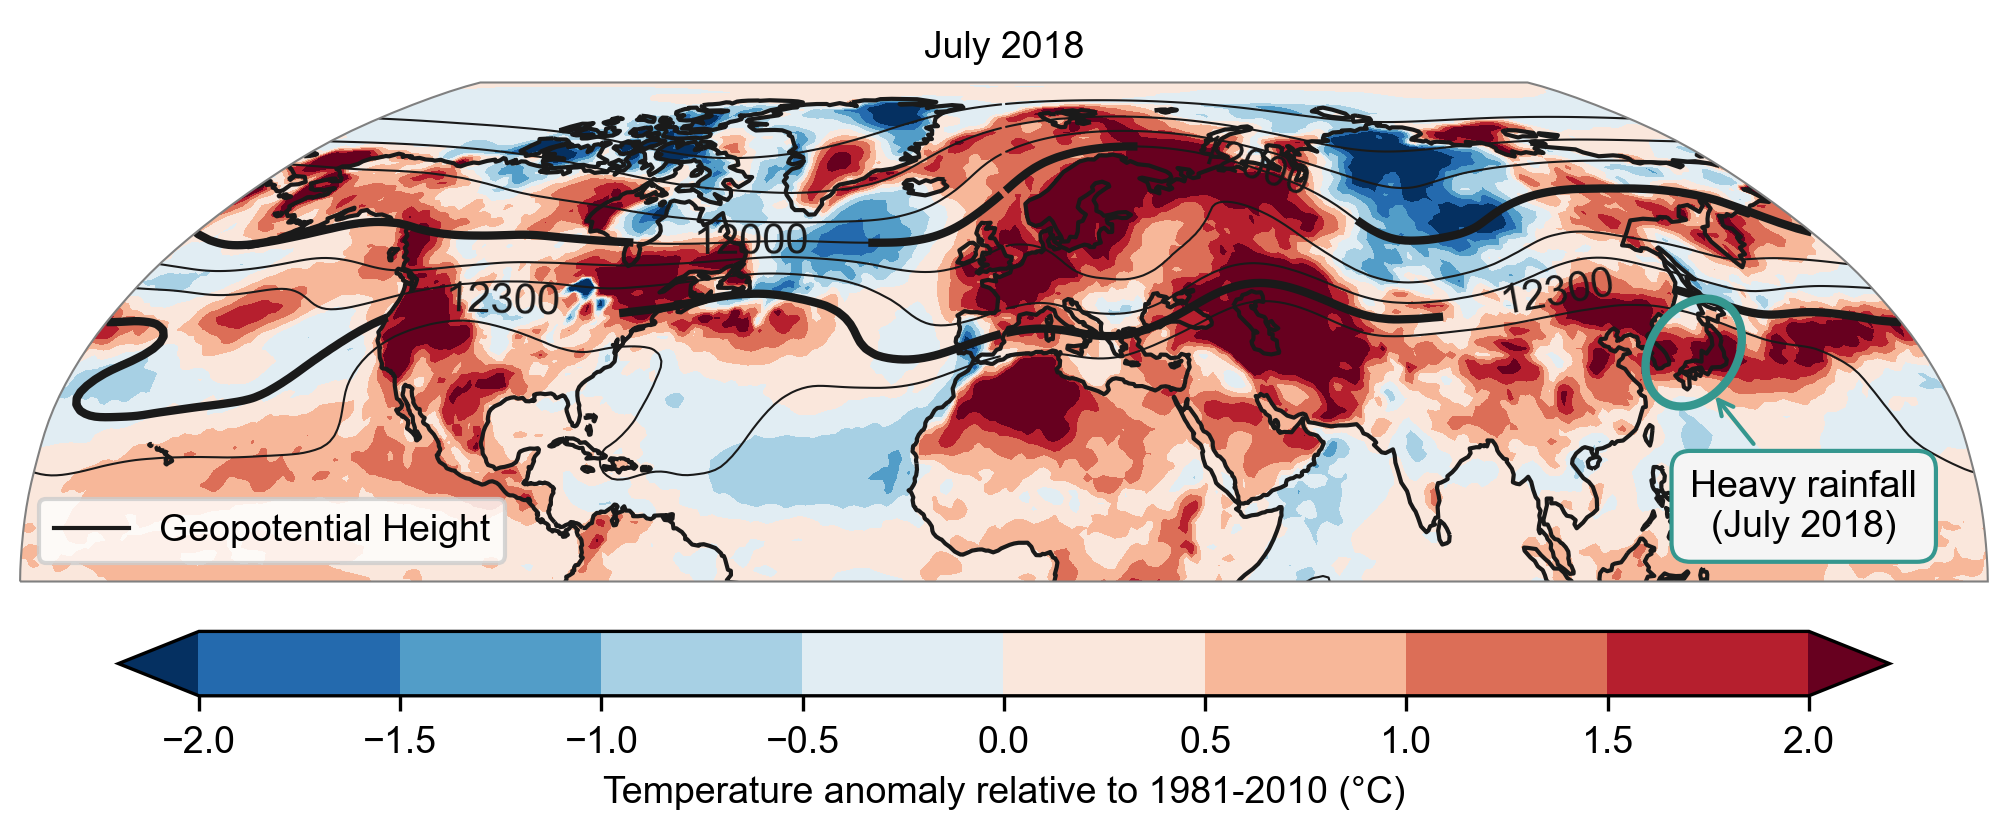
Figure caption
Box 11.4, Figure 2 | Meteorological conditions in July 2018. The colour shading shows the monthly mean near-surface air temperature anomaly with respect to 1981–2010. Contour lines indicate the geopotential height in m, highlighted are the isolines on 12,000 m and 12,300 m, which indicate the approximate positions of the polar-front jet and subtropical jet, respectively. The light blue-green ellipse shows the approximate extent of the strong precipitation event that occurred at the beginning of July in the region of Japan and Korea. All data is from the global European Centre for Medium-Range Weather Forecasts (ECMWF) Reanalysis v5 (ERA5, Hersbach et al., 2020).