Back chapter figures
Cross-Chapter Box 11.1, Figure 1
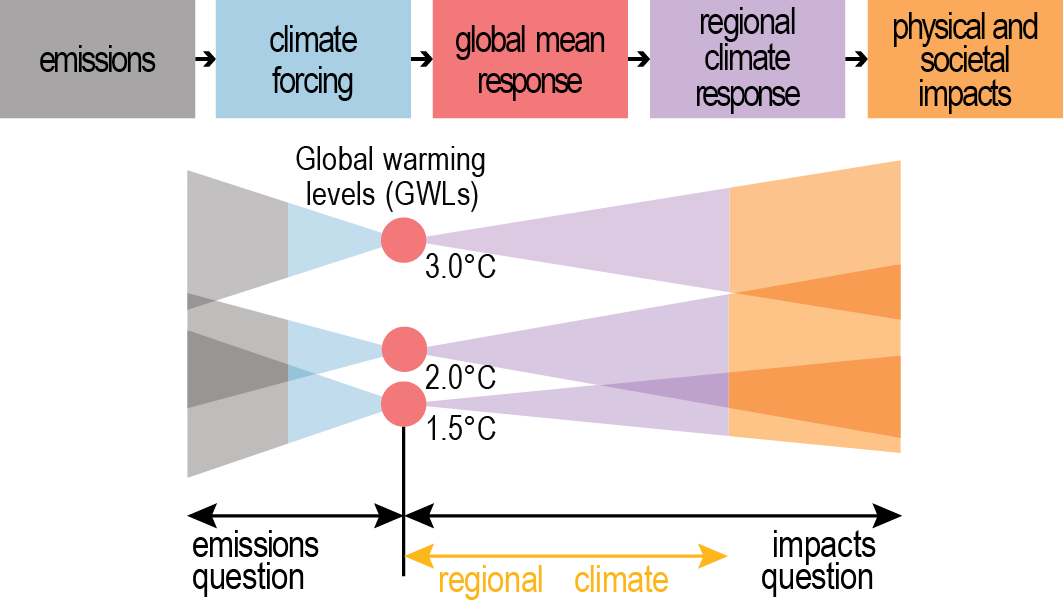
Figure caption
Cross-Chapter Box 11.1, Figure 1 | Schematic representation of relationship between emissions scenarios, global warming levels (GWLs), regional climate responses, and impacts. The illustration shows the implied uncertainty problem associated with differentiating between 1.5°C, 2°C, and other GWLs. Focusing on GWLs raises questions associated with emissions pathways to get to these temperatures (scenarios), as well as regional climate responses and the associated impacts at the corresponding GWL (the impacts question). Adapted from James et al. (2017) and Rogelj (2013) under the terms of the Creative Commons Attribution licence.