Cross-Chapter Box 11.1, Figure 2
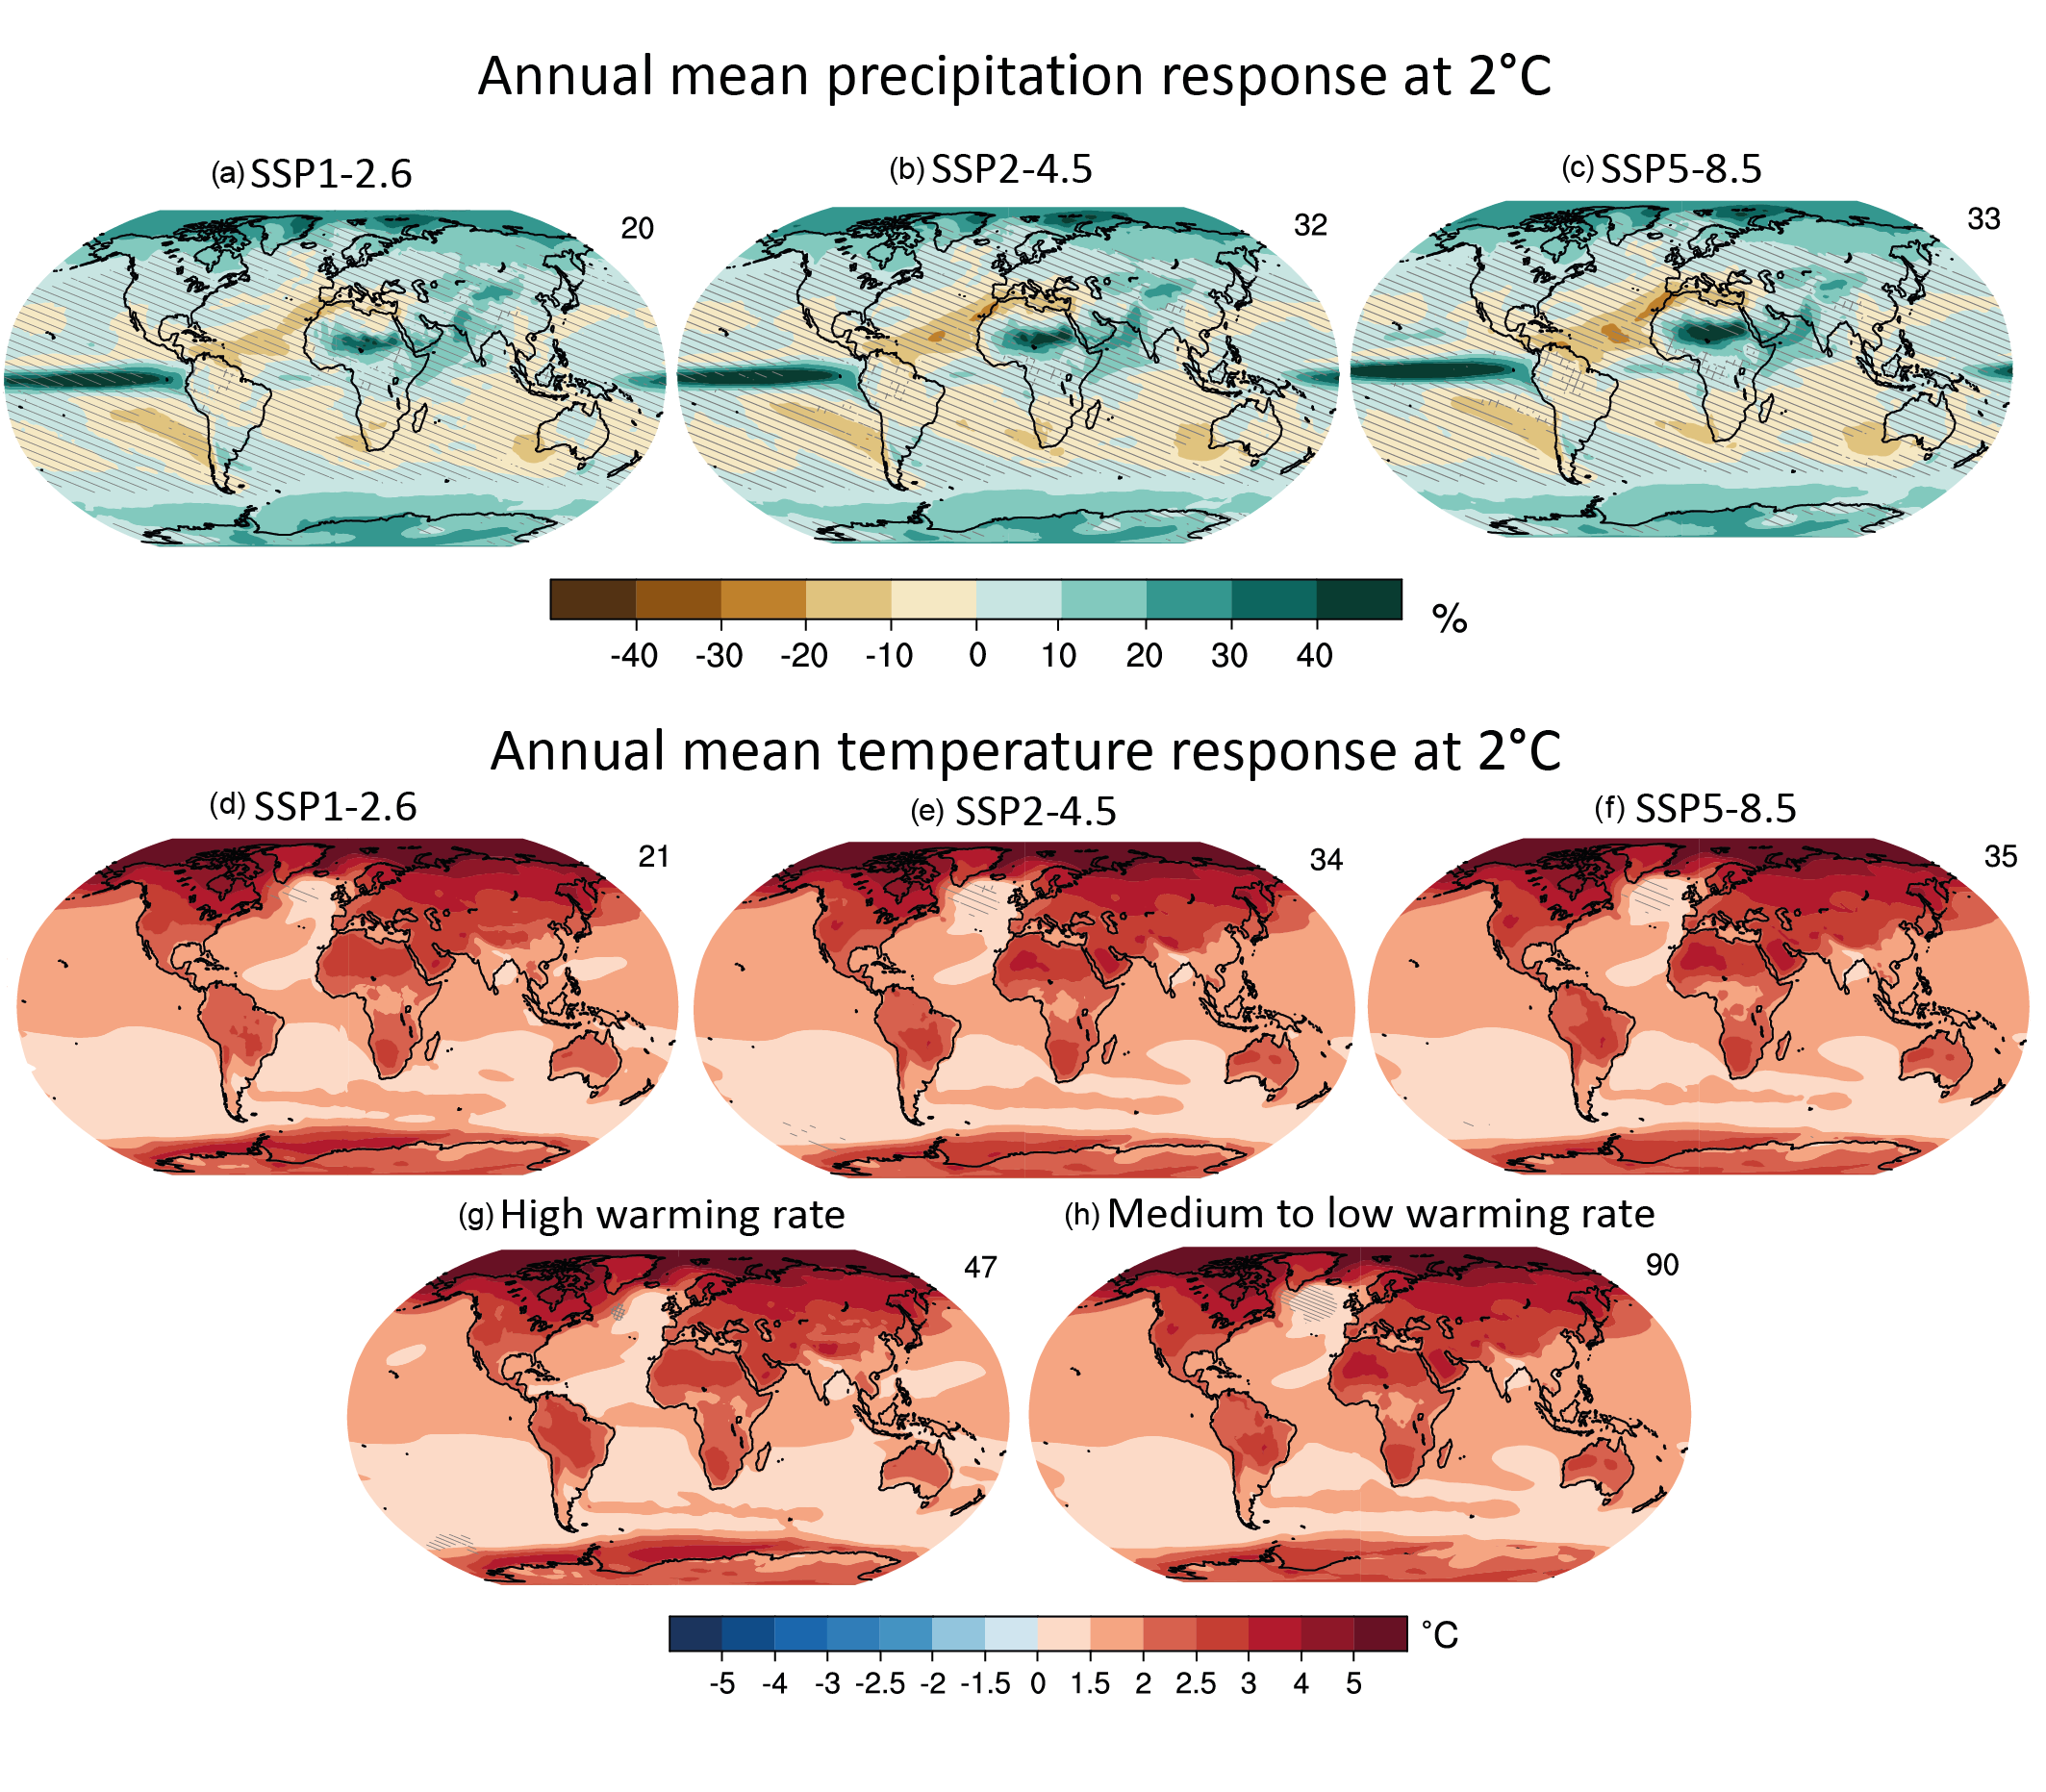
Figure caption
Cross-Chapter Box 11.1, Figure 2 | (a–c) Coupled Model Intercomparison Project Phase 6 (CMIP6) multi-model mean precipitation change at 2°C global warming level (GWL) (20-year mean) in three different Shared Socio-economic Pathway (SSP) scenarios relative to 1850–1900. All models reaching the corresponding GWL in the corresponding scenario are averaged. The number of models averaged across is shown at the top right of the panel. The maps for the other two SSP scenarios SSP1-1.9 (five models only) and SSP3-7.0 (not shown) are consistent. (d–f) Same as (a–c) but for annual mean temperature. (g) Annual mean temperature change at 2°C in CMIP6 models with high warming rate reaching the GWL in the corresponding scenario before the earliest year of the assessed very likely range Section 4.3.4). (h) Climate response at 2°C GWL across all SSP1-1.9, SSP2-2.6, SSP2-4.5. SSP3-7.0 and SSP5-8.5 in all other models not shown in (g). The close agreement of (g) and (h) demonstrates that the mean temperature response at 2°C is not sensitive to the rate of warming, and thereby the global mean surface air temperature (GSAT) warming of the respective models in 2081–2100. Uncertainty is represented using the advanced approach: No overlay indicates regions with robust signal, where ≥66% of models show change greater than the variability threshold and ≥80% of all models agree on the sign of change; diagonal lines indicate regions with no change or no robust signal, where <66% of models show a change greater than the variability threshold; crossed lines indicate regions with conflicting signal, where ≥66% of models show change greater than the variability threshold and <80% of all models agree on the sign of change. For more information on the advanced approach, please refer to the Cross-Chapter Box Atlas.1.