Back chapter figures
FAQ 11.1 Figure 1
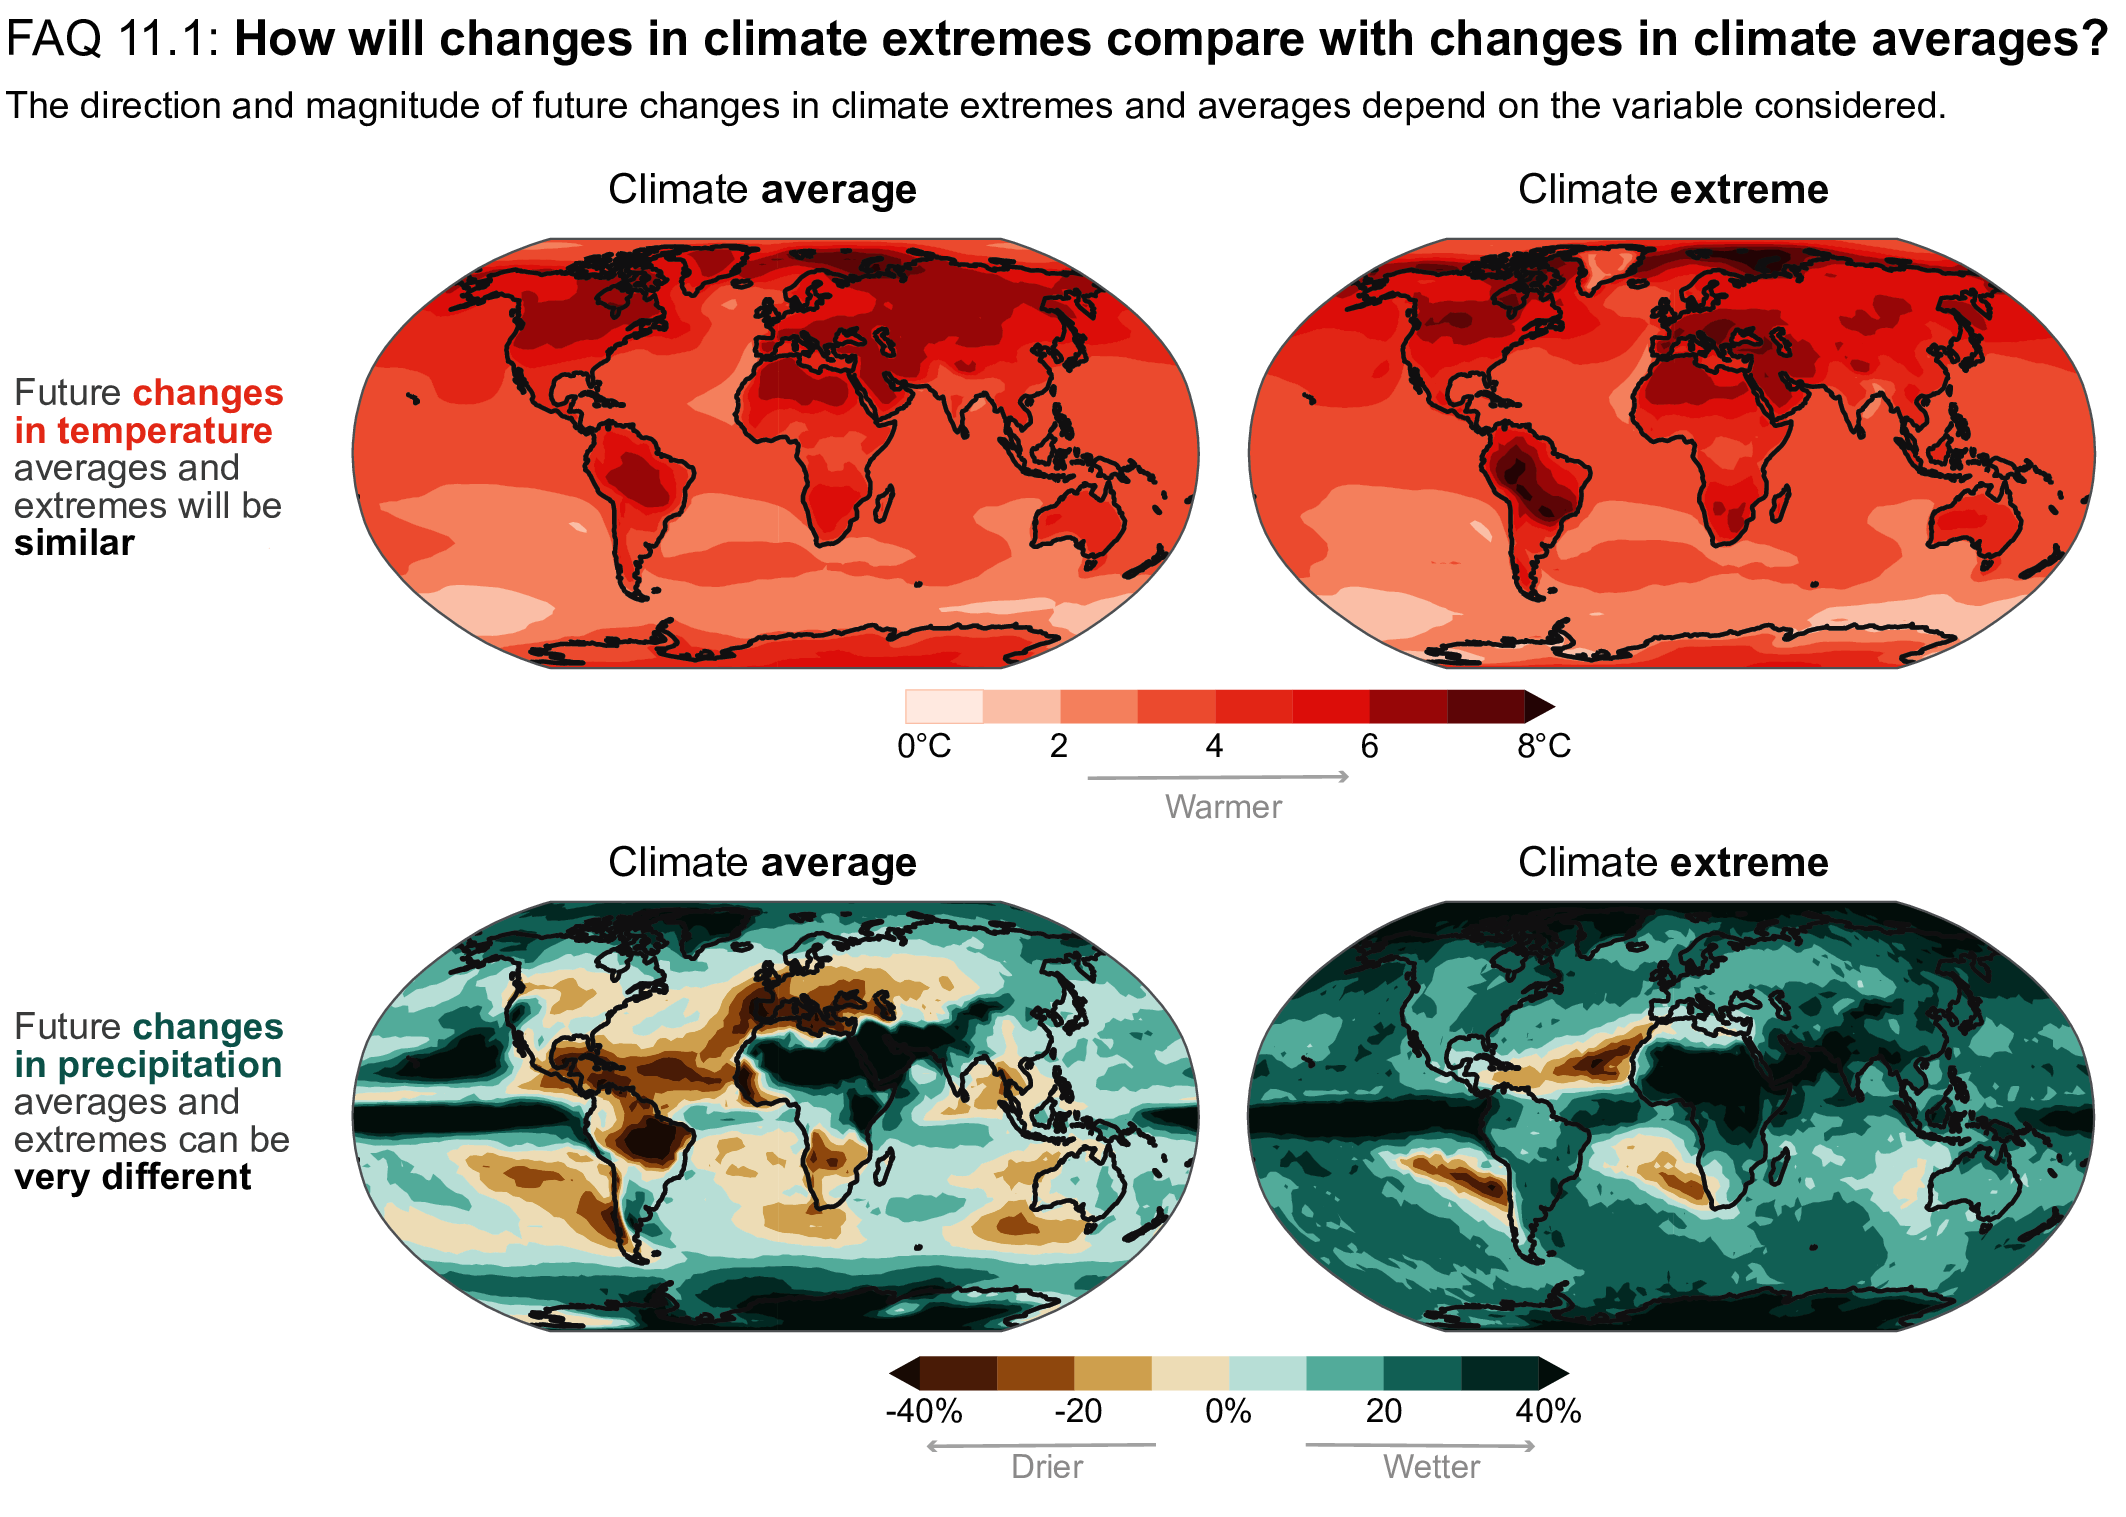
Figure caption
FAQ 11.1, Figure 1 | Global maps of future changes in surface temperature (top panels) and precipitation (bottom panels) for long-term average (left) and extreme conditions (right). All changes were estimated using the Coupled Model Intercomparison Project Phase 6 (CMIP6) ensemble median for a scenario with a global warming of 4°C relative to 1850–1900 temperatures. Average surface temperatures refer to the warmest three-month season (summer in mid- to high latitudes) and extreme temperatures refer to the hottest day in a year. Precipitation changes, which can include both rainfall and snowfall changes, are normalized by 1850–1900 values and shown as a percentage; extreme precipitation refers to the largest daily precipitation in a year.