Back chapter figures
Figure 11.10
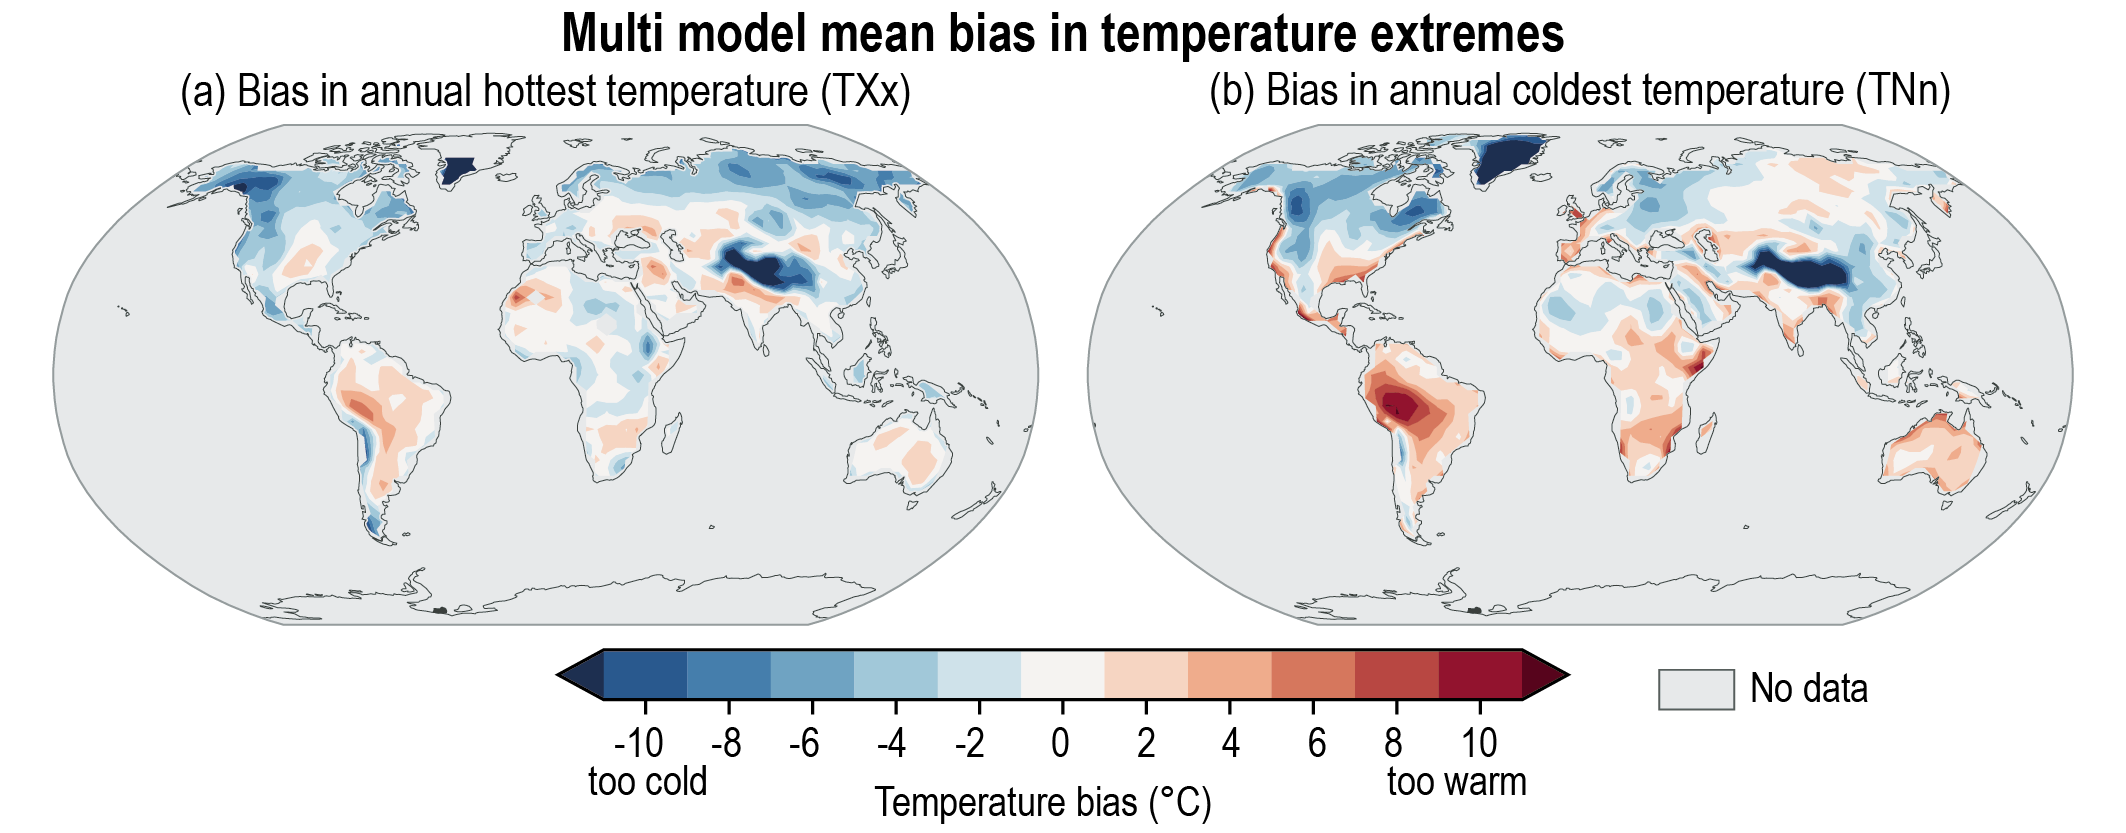
Figure caption
Figure 11.10 | Multi-model mean bias in temperature extremes (°C) for the period 1979–2014, calculated as the difference between the Coupled Model Intercomparison Project Phase 6 (CMIP6) multi-model mean and the average of observations from the values available in HadEX3. (a) The annual hottest temperature(TXx); and (b) the annual coldest temperature (TNn). Areas without sufficient data are shown in grey. Adapted from Wehner et al. (2020) under the terms of the Creative Commons Attribution licence. Further details on data sources and processing are available in the chapter data table (Table 11.SM.9).