Back chapter figures
Figure 11.13
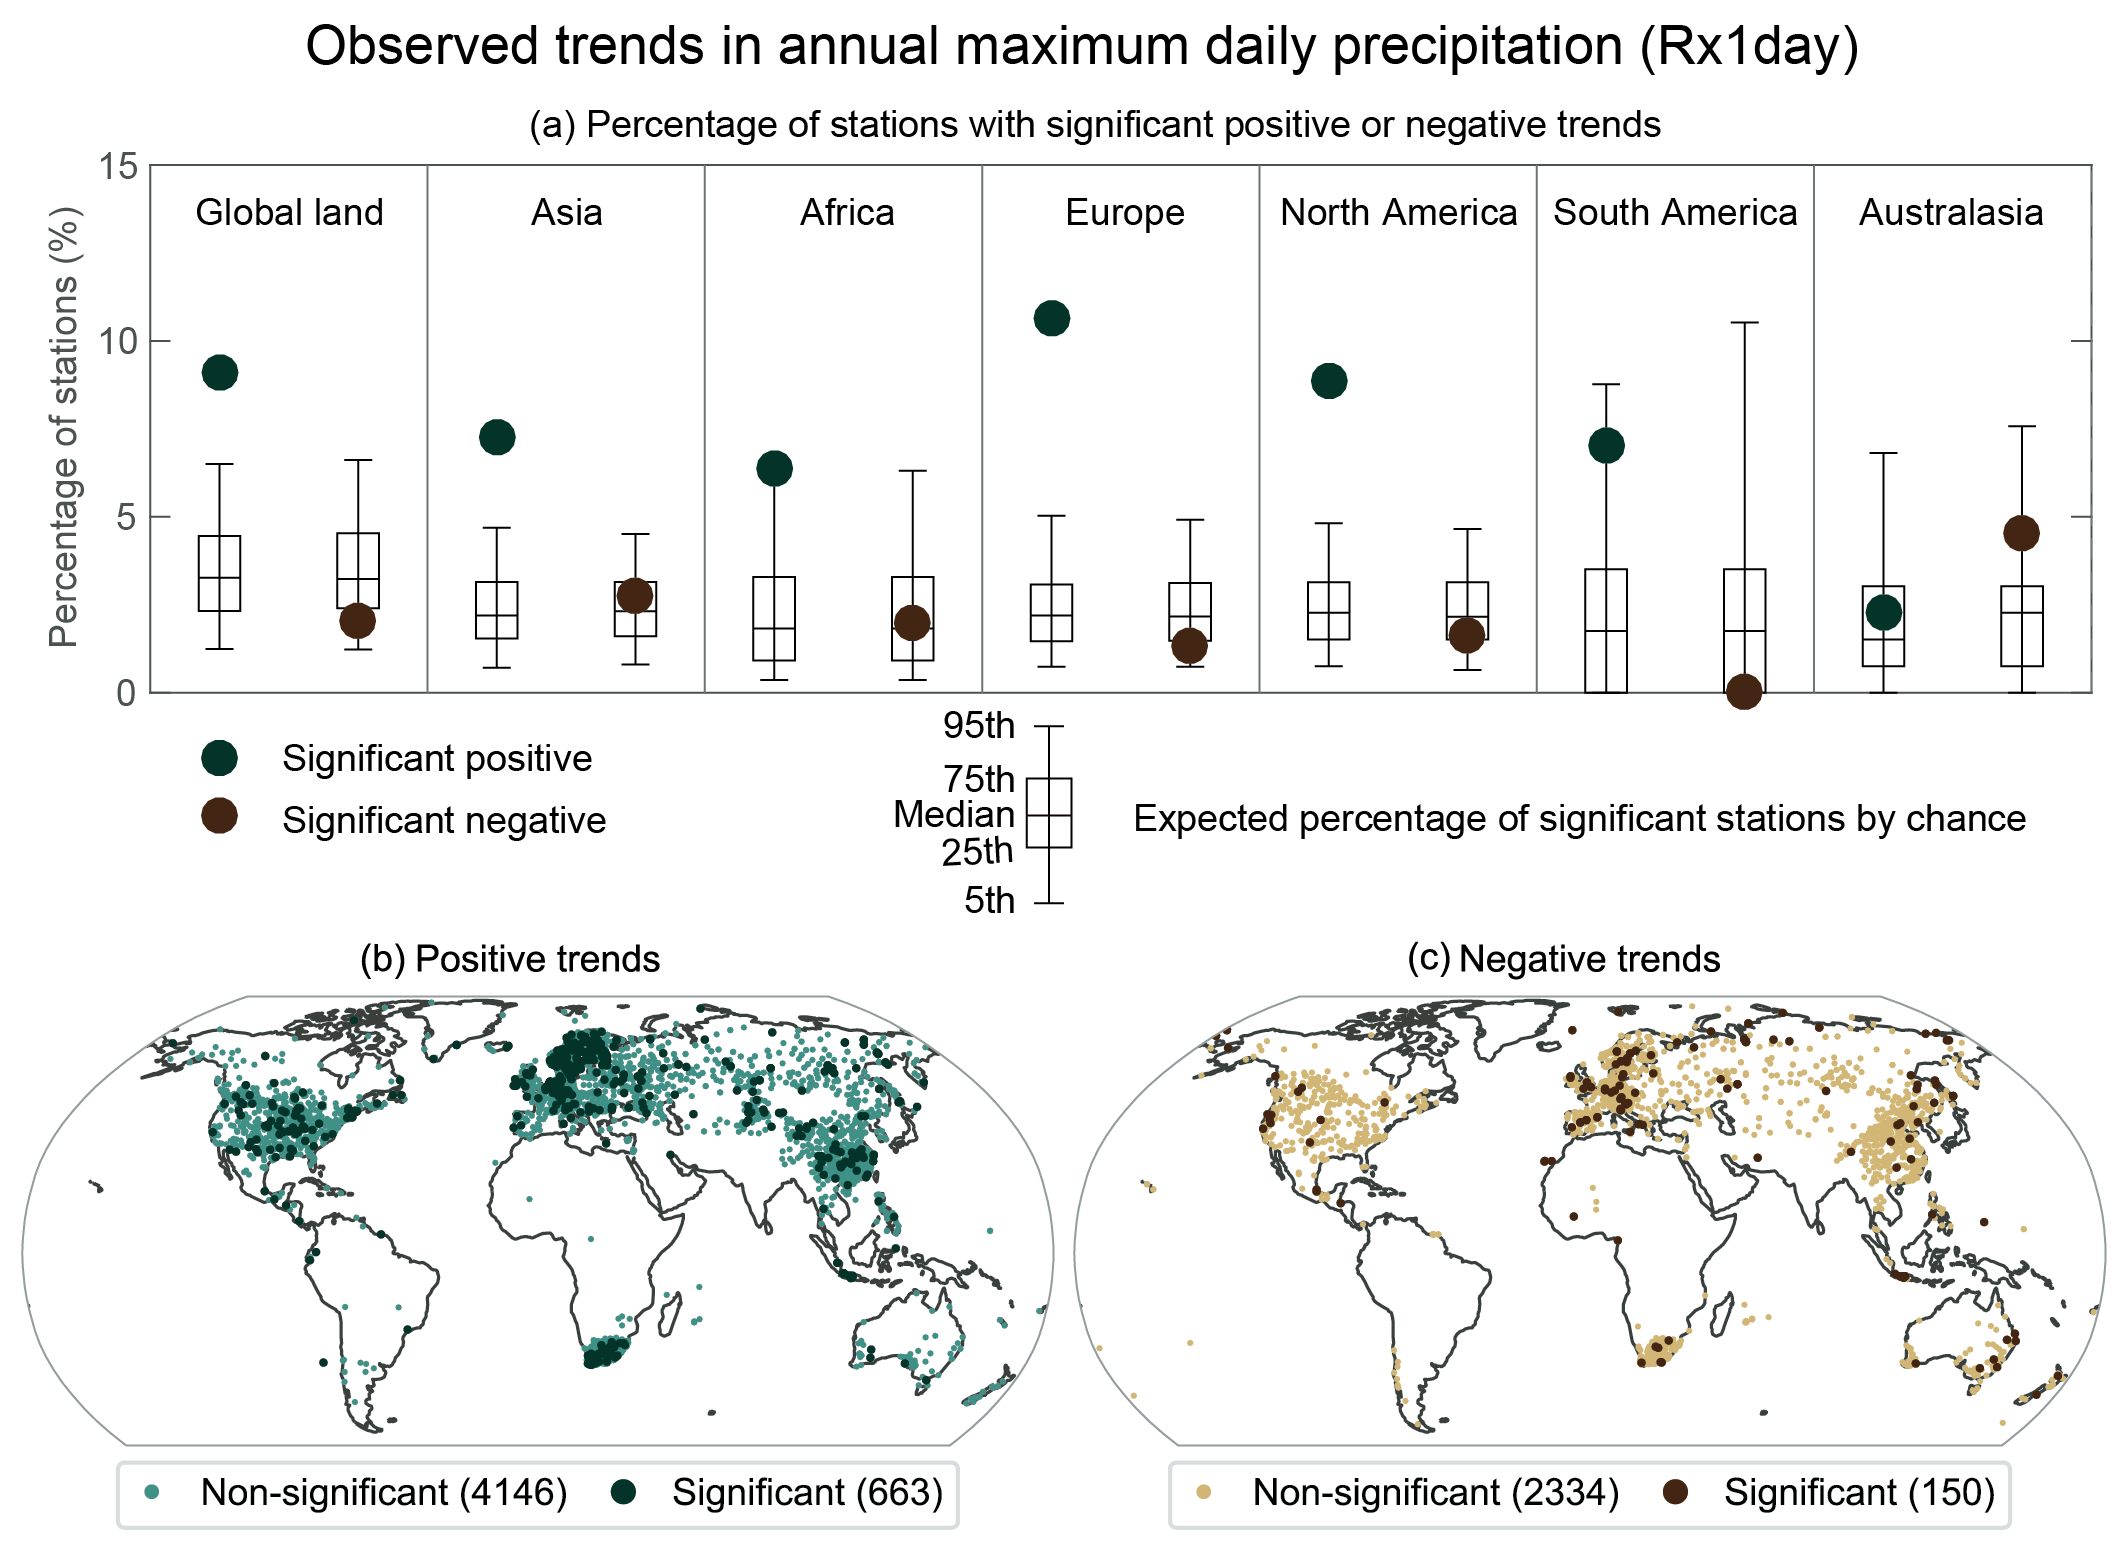
Figure caption
Figure 11.13 | Signs and significance of the observed trends in annual maximum daily precipitation (Rx1day) during 1950–2018 at 8345 stations with sufficient data. (a) Percentage of stations with statistically significant trends in Rx1day; green dots show positive trends and brown dots negative trends. Box and ‘whisker’ plots indicate the expected percentage of stations with significant trends due to chance estimated from 1000 bootstrap realizations under a no-trend null hypothesis. The boxes mark the median, 25th percentile, and 75th percentile. The upper and lower whiskers show the 97.5th and the 2.5th percentiles, respectively. Maps of stations with positive (b) and negative (c) trends. The light colour indicates stations with non-significant trends, and the dark colour stations with significant trends. Significance is determined by a two-tailed test conducted at the 5% level. Adapted from Sun et al. (2021). Figure copyright © American Meteorological Society (used with permission). Further details on data sources and processing are available in the chapter data table (Table 11.SM.9).