Back chapter figures
Figure 11.16
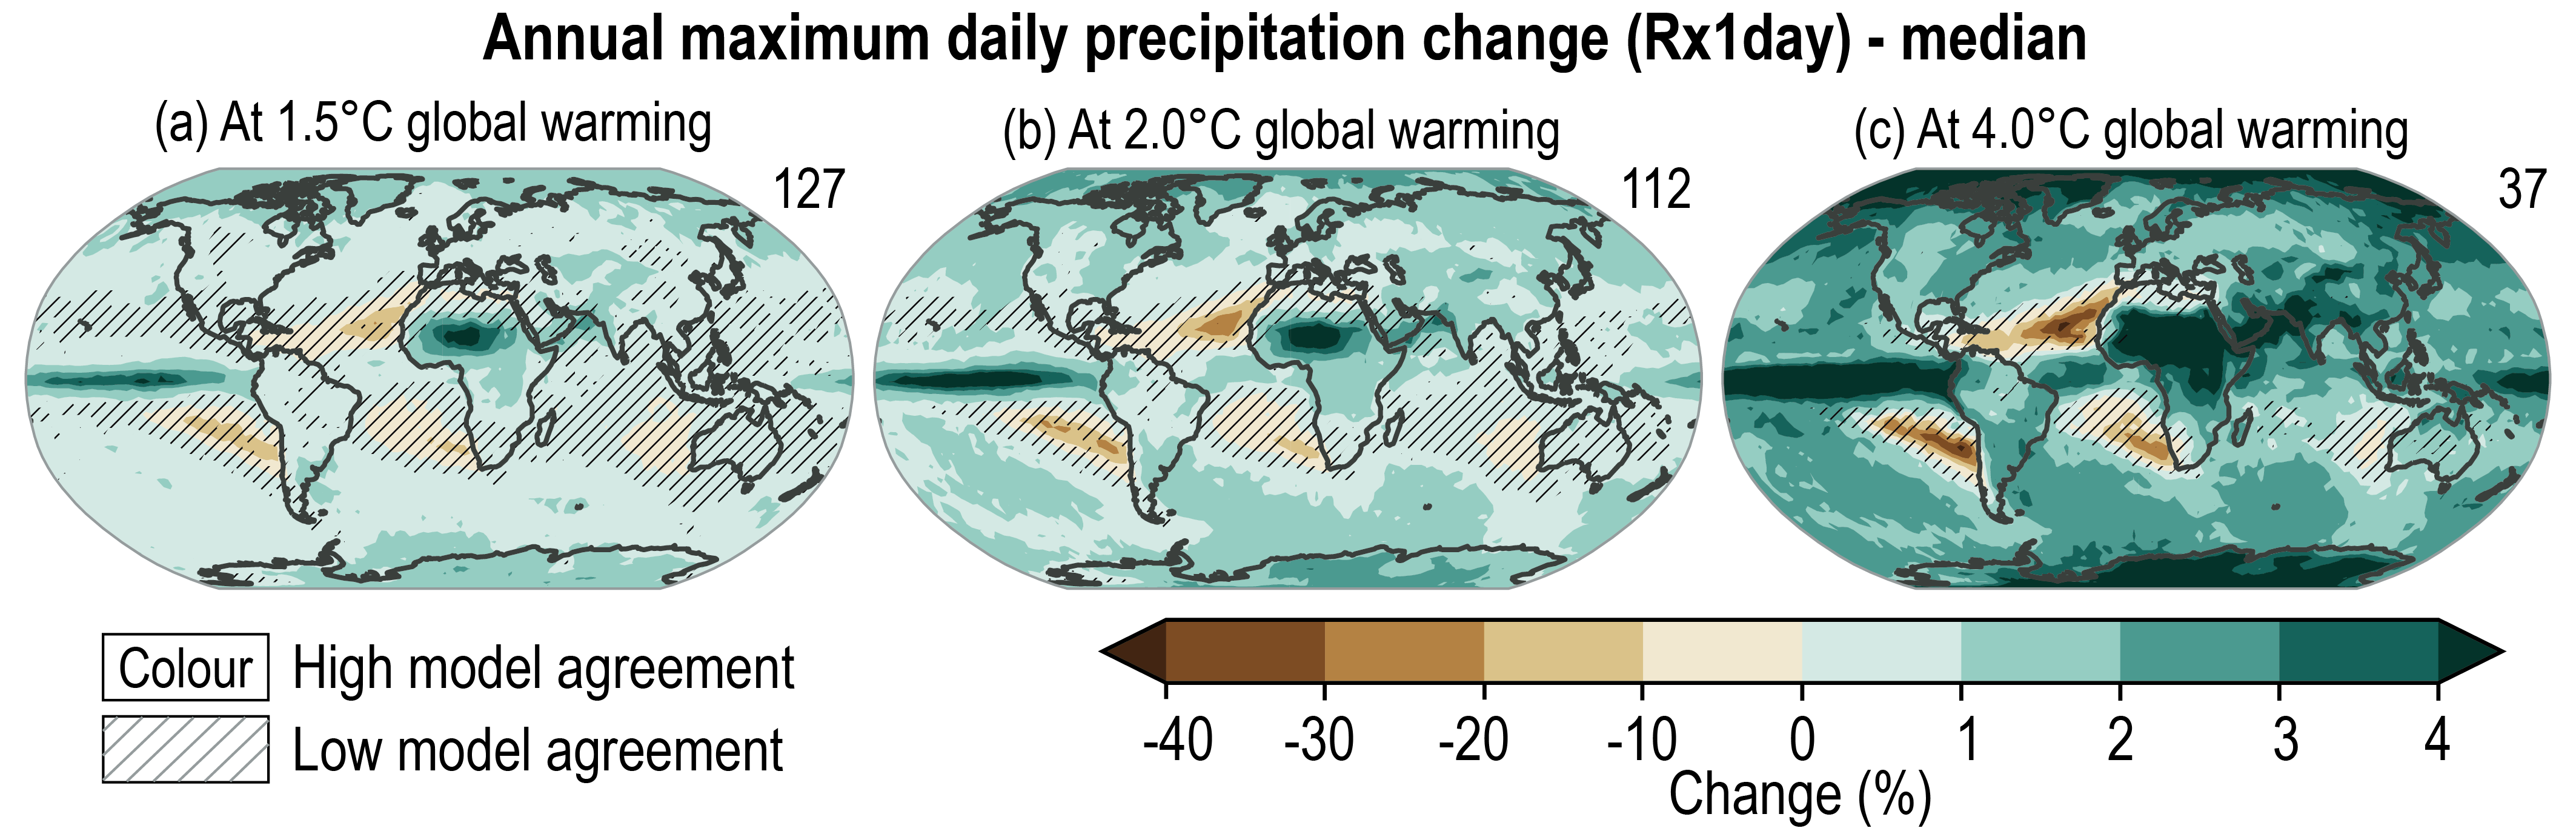
Figure caption
Figure 11.16 | Projected changes in annual maximum daily precipitation at (a) 1.5°C, (b) 2°C, and (c) 4°C of global warming compared to the 1850–1900 baseline. Results are based on simulations from the Coupled Model Intercomparison Project Phase 6 (CMIP6) multi-model ensemble under the Shared Socio-economic Pathway (SSP), SSP1-1.9, SSP1-2.6, SSP2-4.5, SSP3-7.0, and SSP5-8.5 scenarios. The numbers on the top right indicate the number of simulations included. Uncertainty is represented using the simple approach: no overlay indicates regions with high model agreement, where ≥80% of models agree on the sign of change; diagonal lines indicate regions with low model agreement, where <80% of models agree on the sign of change. For more information on the simple approach, please refer to the Cross-Chapter Box Atlas 1. For details on the methods see Supplementary Material 11.SM.2. Changes in Rx1day are also displayed in the Interactive Atlas. Further details on data sources and processing are available in the chapter data table (Table 11.SM.9).