Back chapter figures
Figure 11.17
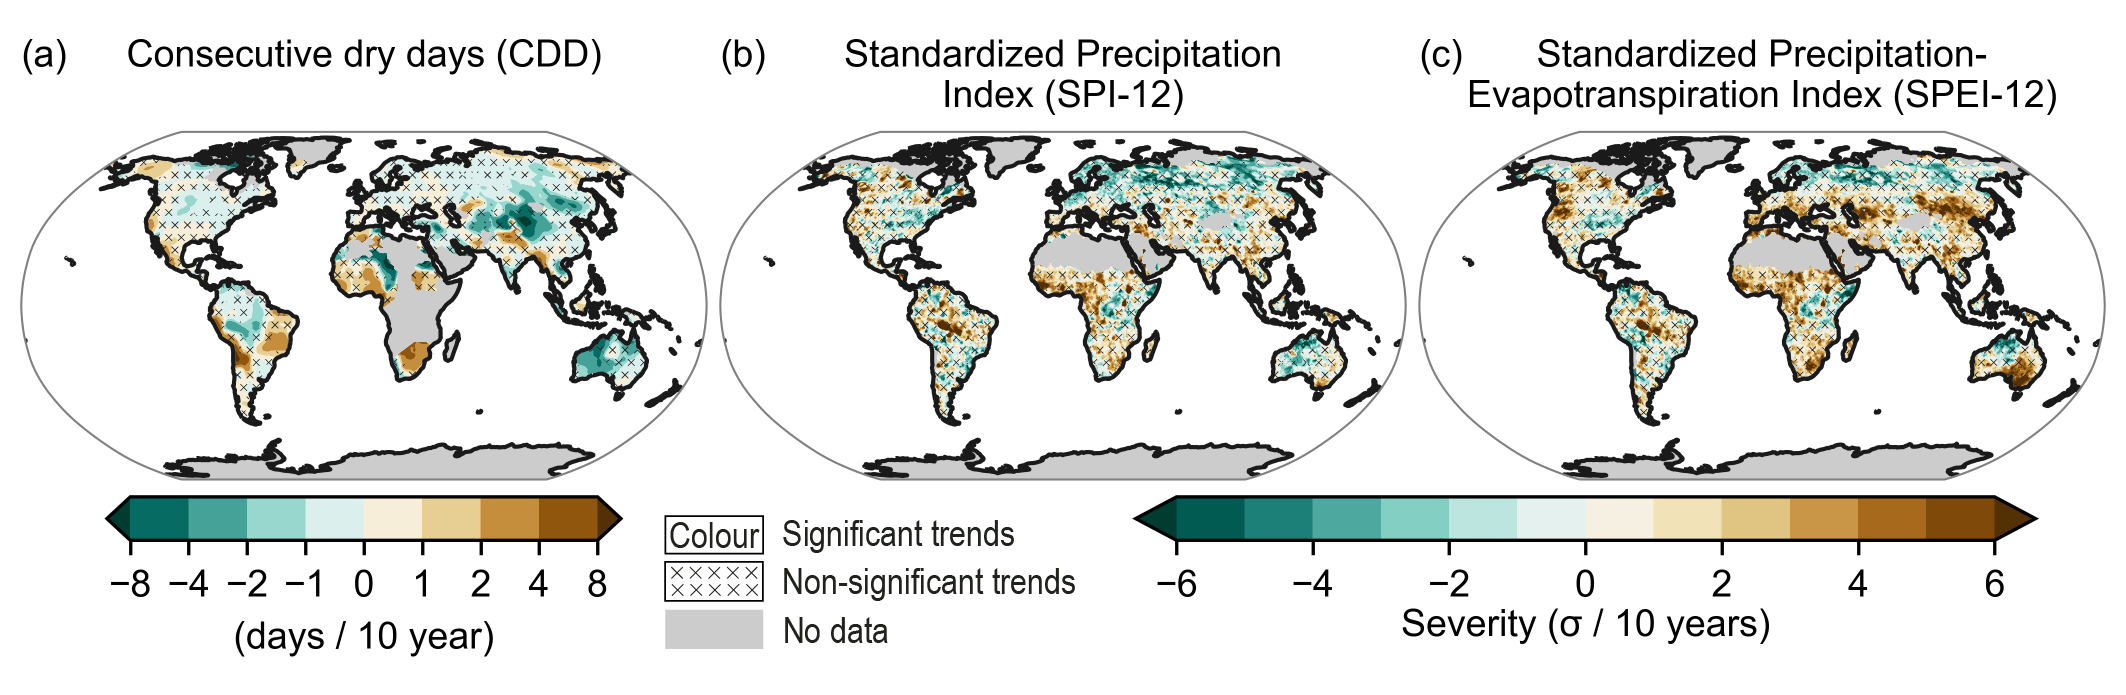
Figure caption
Figure 11.17 | Observed linear trend for (a) consecutive dry days (CDD) during 1960–2018, (b) standardized precipitation index (SPI) and (c) standardized precipitation-evapotranspiration index (SPEI) during 1951–2016. CDD data are from the HadEx3 dataset (Dunn et al., 2020), trend calculation of CDD as in Figure 11.9. Drought severity is estimated using 12-month SPI (SPI-12) and 12-month SPEI (SPEI-12). SPI and SPEI datasets are from Spinoni et al. (2019). The threshold to identify drought episodes was set at -1 SPI/SPEI units. Areas without sufficient data are shown in grey. No overlay indicates regions where the trends are significant at the p = 0.1 level. Crosses indicate regions where trends are not significant. For details on the methods see Supplementary Material 11.SM.2. Further details on data sources and processing are available in the chapter data table (Table 11.SM.9).