Back chapter figures
Figure 11.18
Figure caption
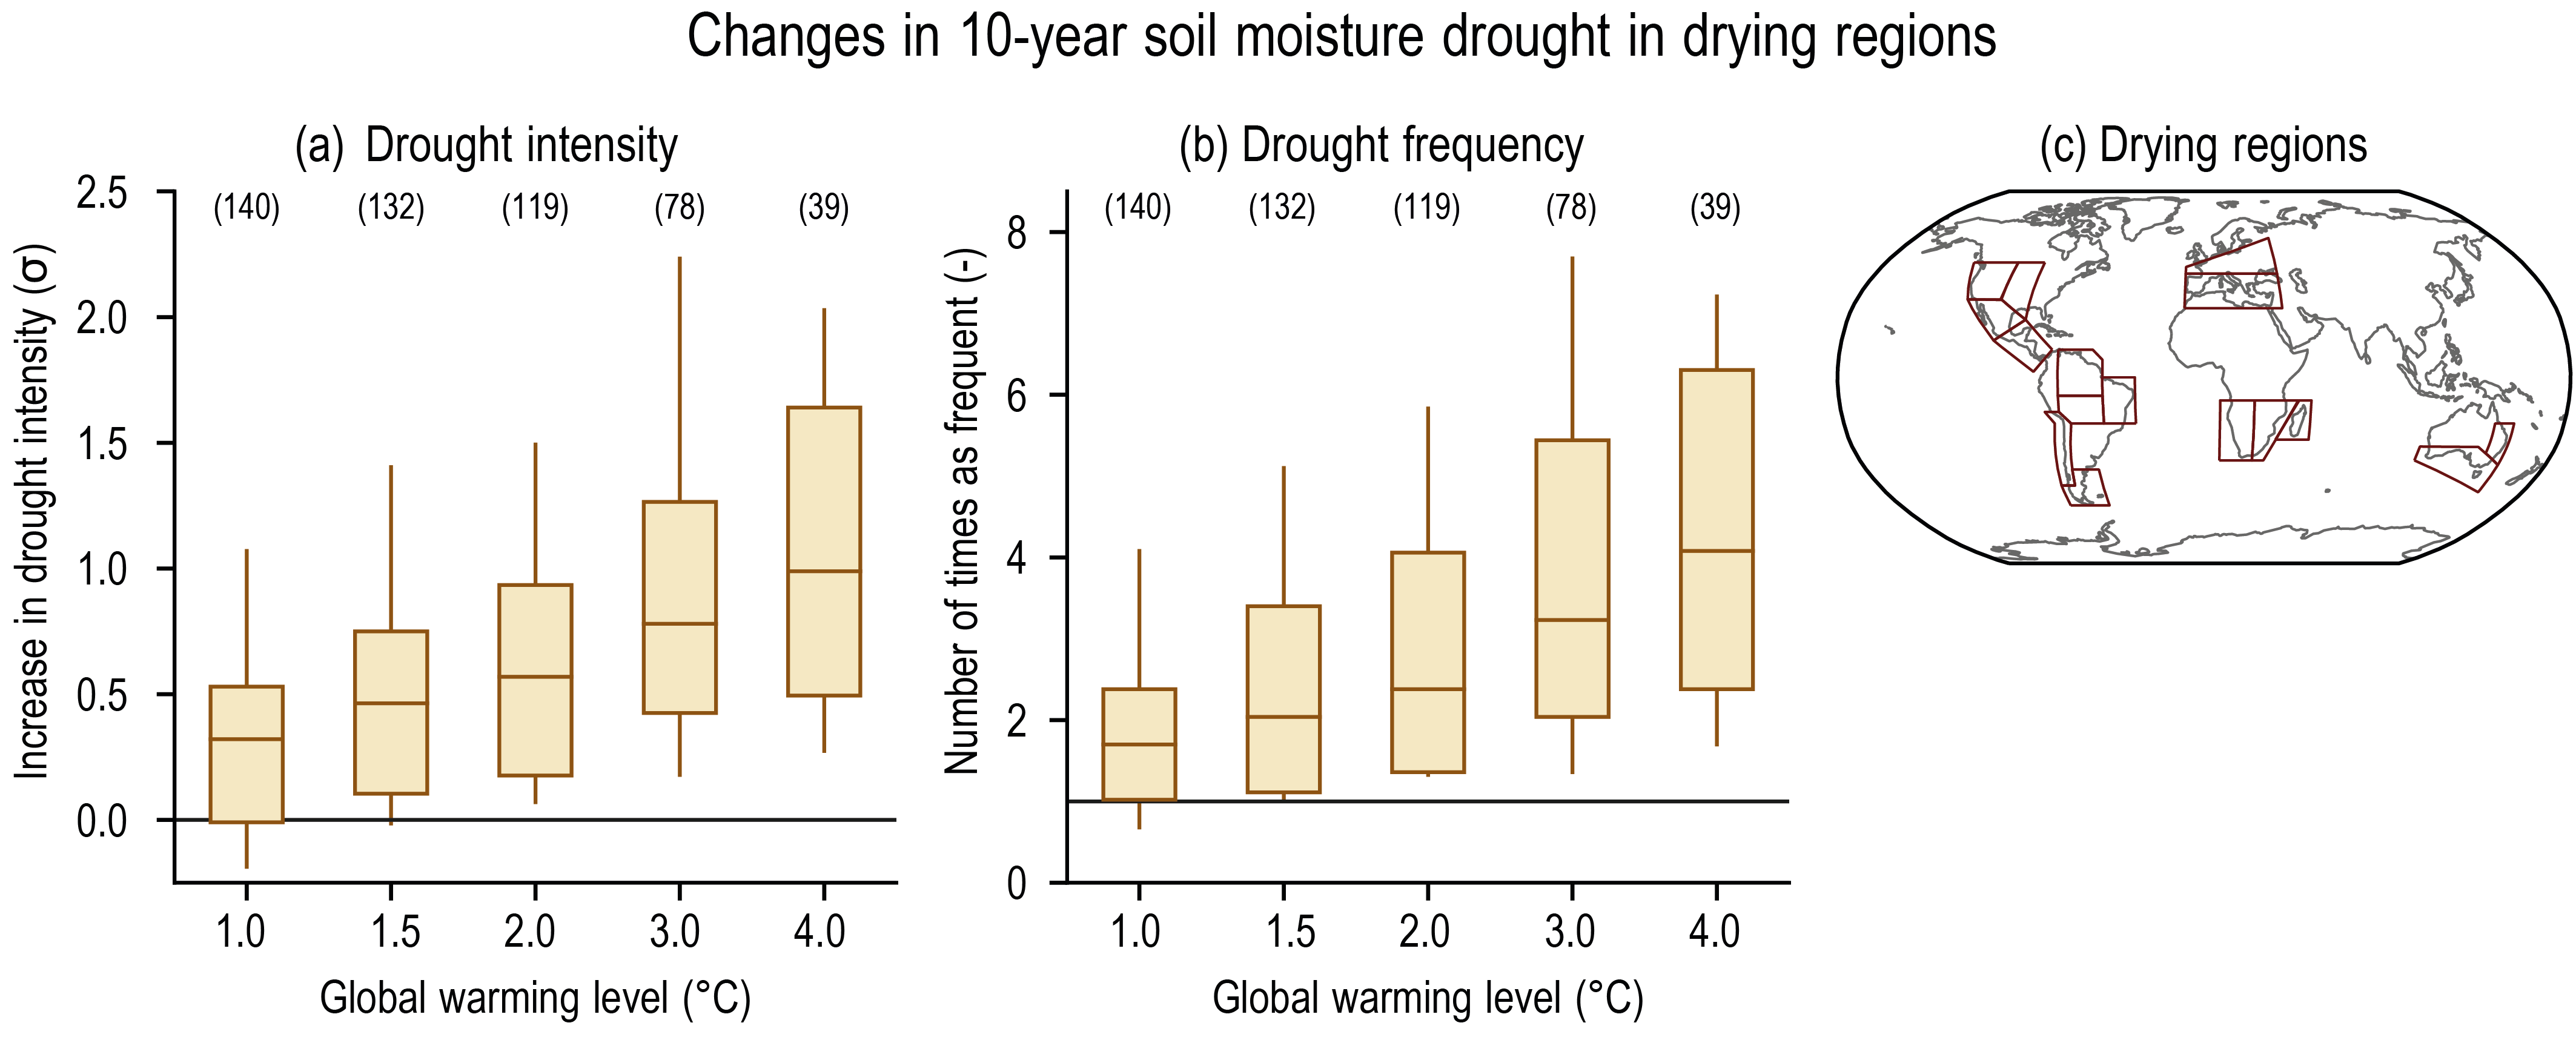
Figure 11.18 | Projected changes in (a) the intensity and (b) the frequency of drought under 1°C, 1.5°C, 2°C, 3°C, and 4°C global warming levels relative to the 1850–1900 baseline. (c) Summaries are computed for the AR6 regions in which there is at least medium confidence in an increase in agriculture/ecological drought at the 2°C global warming level (‘drying regions’), including Western North America, Central North America, North Central America, Southern Central America, Northern South America, North-Eastern South America, South American Monsoon, South-Western South America, Southern South America, West and Central Europe, Mediterranean, West Southern Africa, East Southern Africa, Madagascar, Eastern Australia, Southern Australia. Caribbean is not included in the calculation because the number of land grid points was too small. A drought event is defined as a 10-year drought event whose annual mean soil moisture was below its 10th percentile from the 1850–1900 base period. For each box plot, the horizontal line and the box represent the median and central 66% uncertainty range, respectively, of the frequency or the intensity changes across the multi-model ensemble, and the ‘whiskers’ extend to the 90% uncertainty range. The line of zero in (a) indicates no change in intensity, while the line of one in (b) indicates no change in frequency. The results are based on the multi-model ensemble estimated from simulations of global climate models contributing to the Coupled Model Intercomparison Project Phase 6 (CMIP6) under different Shared Socio-economic Pathway (SSP) forcing scenarios. Intensity changes in (a) are expressed as standard deviations of the interannual variability in the period 1850–1900 of the corresponding model. For details on the methods see Supplementary Material 11.SM.2. Further details on data sources and processing are available in the chapter data table (Table 11.SM.9).
