Back chapter figures
Figure 11.2
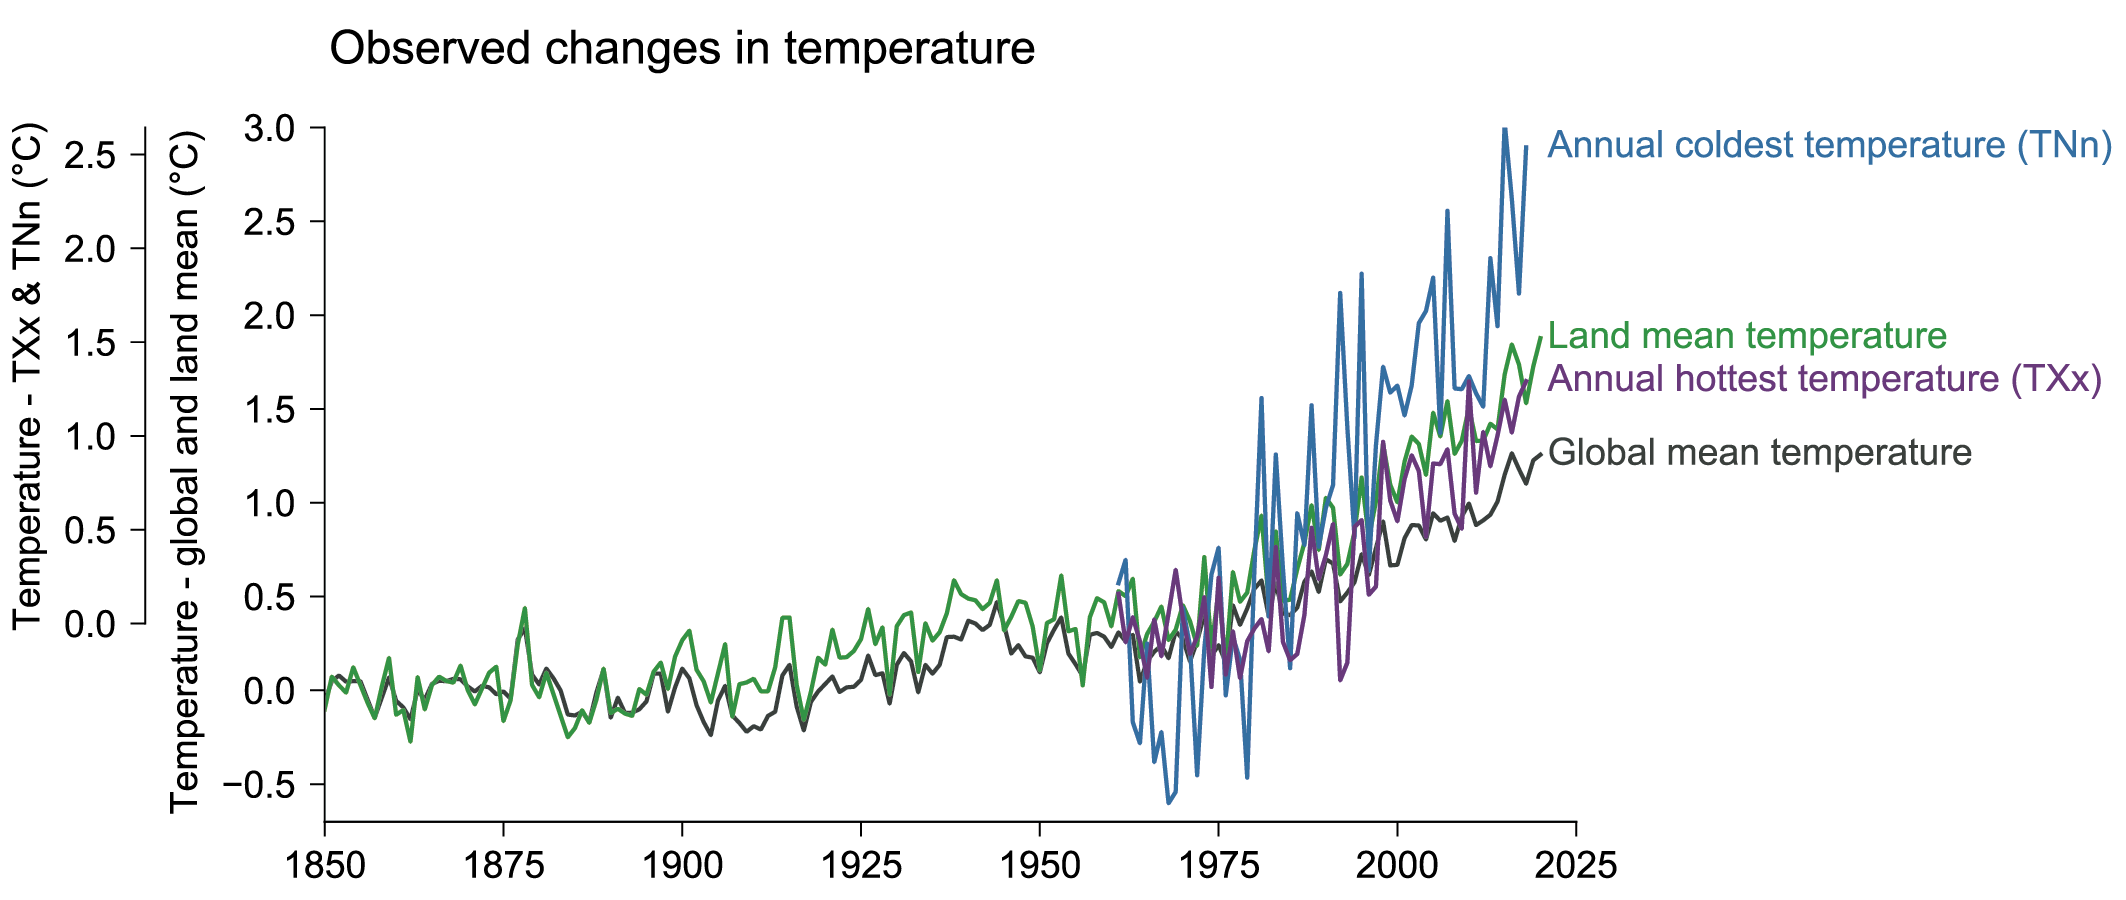
Figure caption
Figure 11.2 | Time series of observed temperature anomalies for global average annual mean temperature (black), land average annual mean temperature (green), land average annual hottest daily maximum temperature (TXx, purple), and land average annual coldest daily minimum temperature (TNn, blue). Global and land mean temperature anomalies are relative to their 1850–1900 means and are based on the multi-product mean annual time series assessed in Section 2.3.1.1.3 (see text for references). TXx and TNn anomalies are relative to their respective 1961–1990 means and are based on the HadEX3 dataset (Dunn et al., 2020) using values for grid boxes with at least 90% temporal completeness over 1961–2018. Further details on data sources and processing are available in the chapter data table (Table 11.SM.9).