Back chapter figures
Figure 11.3
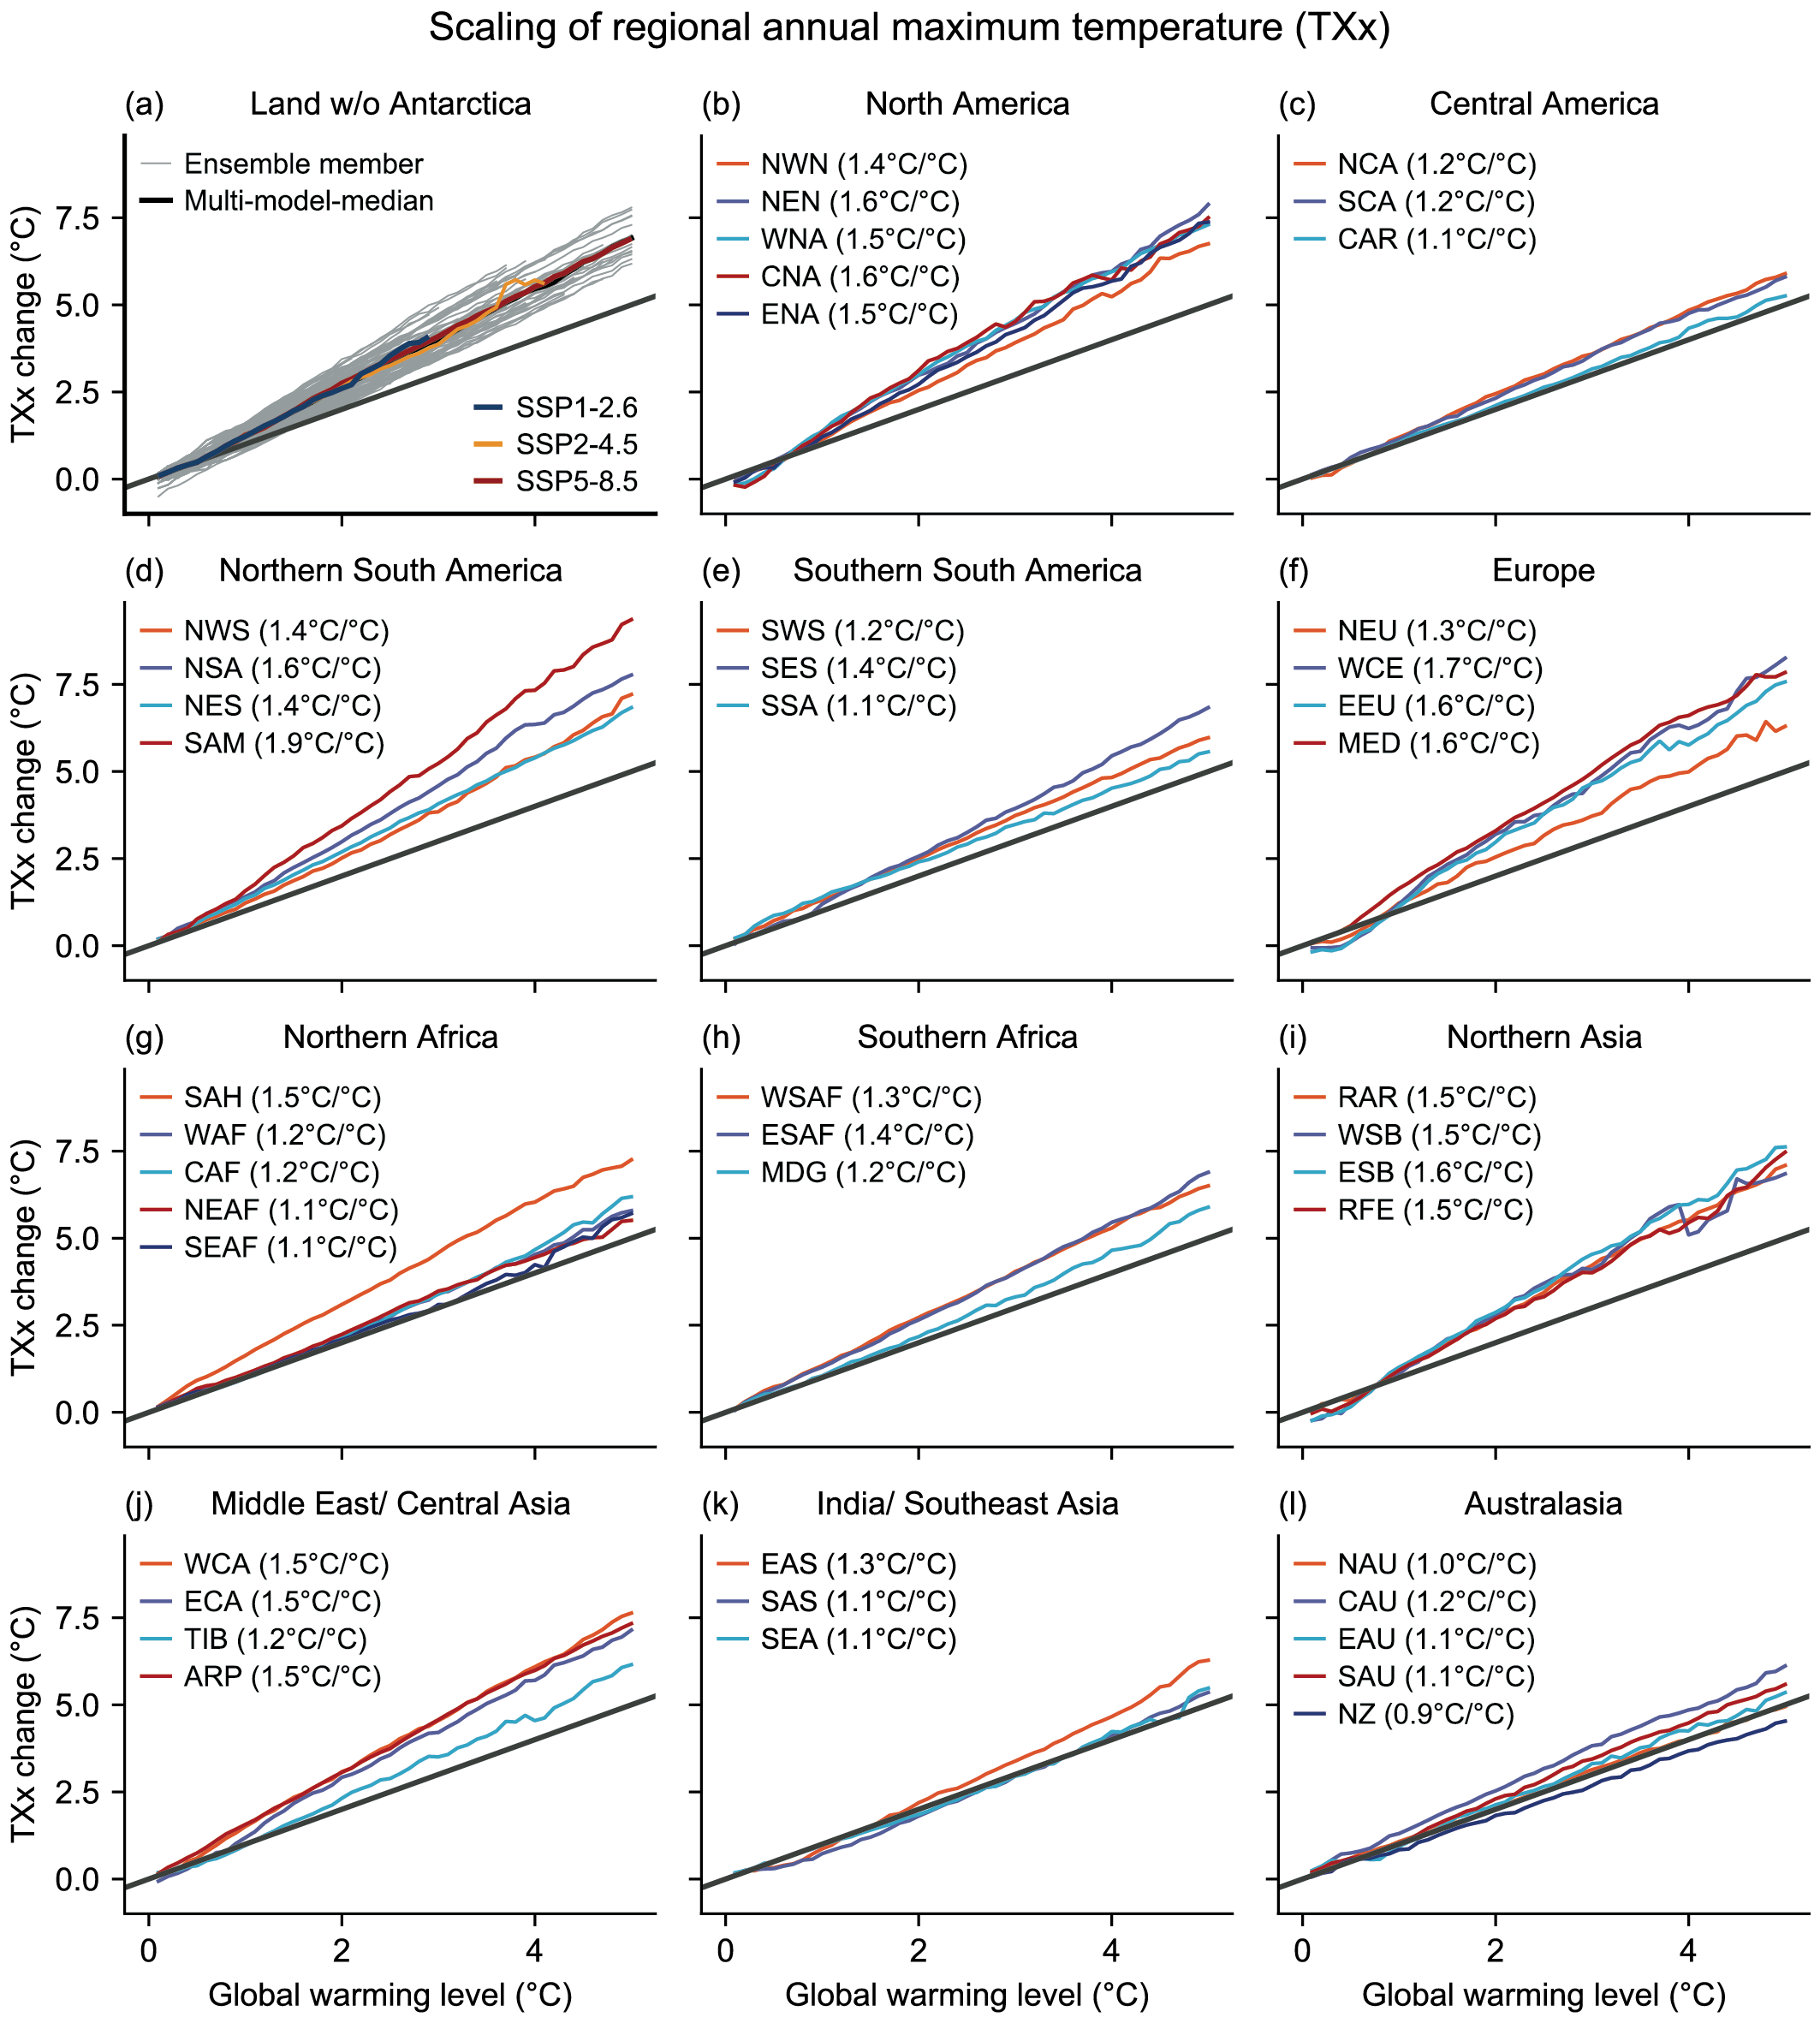
Figure caption
Figure 11.3 | Regional mean changes in annual hottest daily maximum temperature (TXx) for AR6 land regions and the global land area (except Antarctica), against changes in global mean surface air temperature (GSAT) as simulated by Coupled Model Intercomparison Project Phase 6 (CMIP6) models under different Shared Socio-economic Pathway (SSP) forcing scenarios, SSP1.9-1, SSP1.6-2, SSP2-4.5, SSP3-7. 0, and SSP5-8.5. Changes in TXx and GSAT are relative to the 1850–1900 baseline, and changes in GSAT are expressed as global warminglevel. (a) Individual models from the CMIP6 ensemble (grey), the multi-model median under three selected SSPs (colours), and the multi-modelmedian (black); (b) to (l) Multi-model median for the pooled data for individual AR6 regions. Numbers in parentheses indicate the linear scaling between regional TXx and GSAT. The black line indicates the 1:1 reference scaling between TXx and GSAT. See Atlas.1.3.2 for the definition of regions. Changes in TXx are also displayed in the Interactive Atlas. For details on the methods, see Supplementary Material 11.SM.2.