Back chapter figures
Figure 11.4
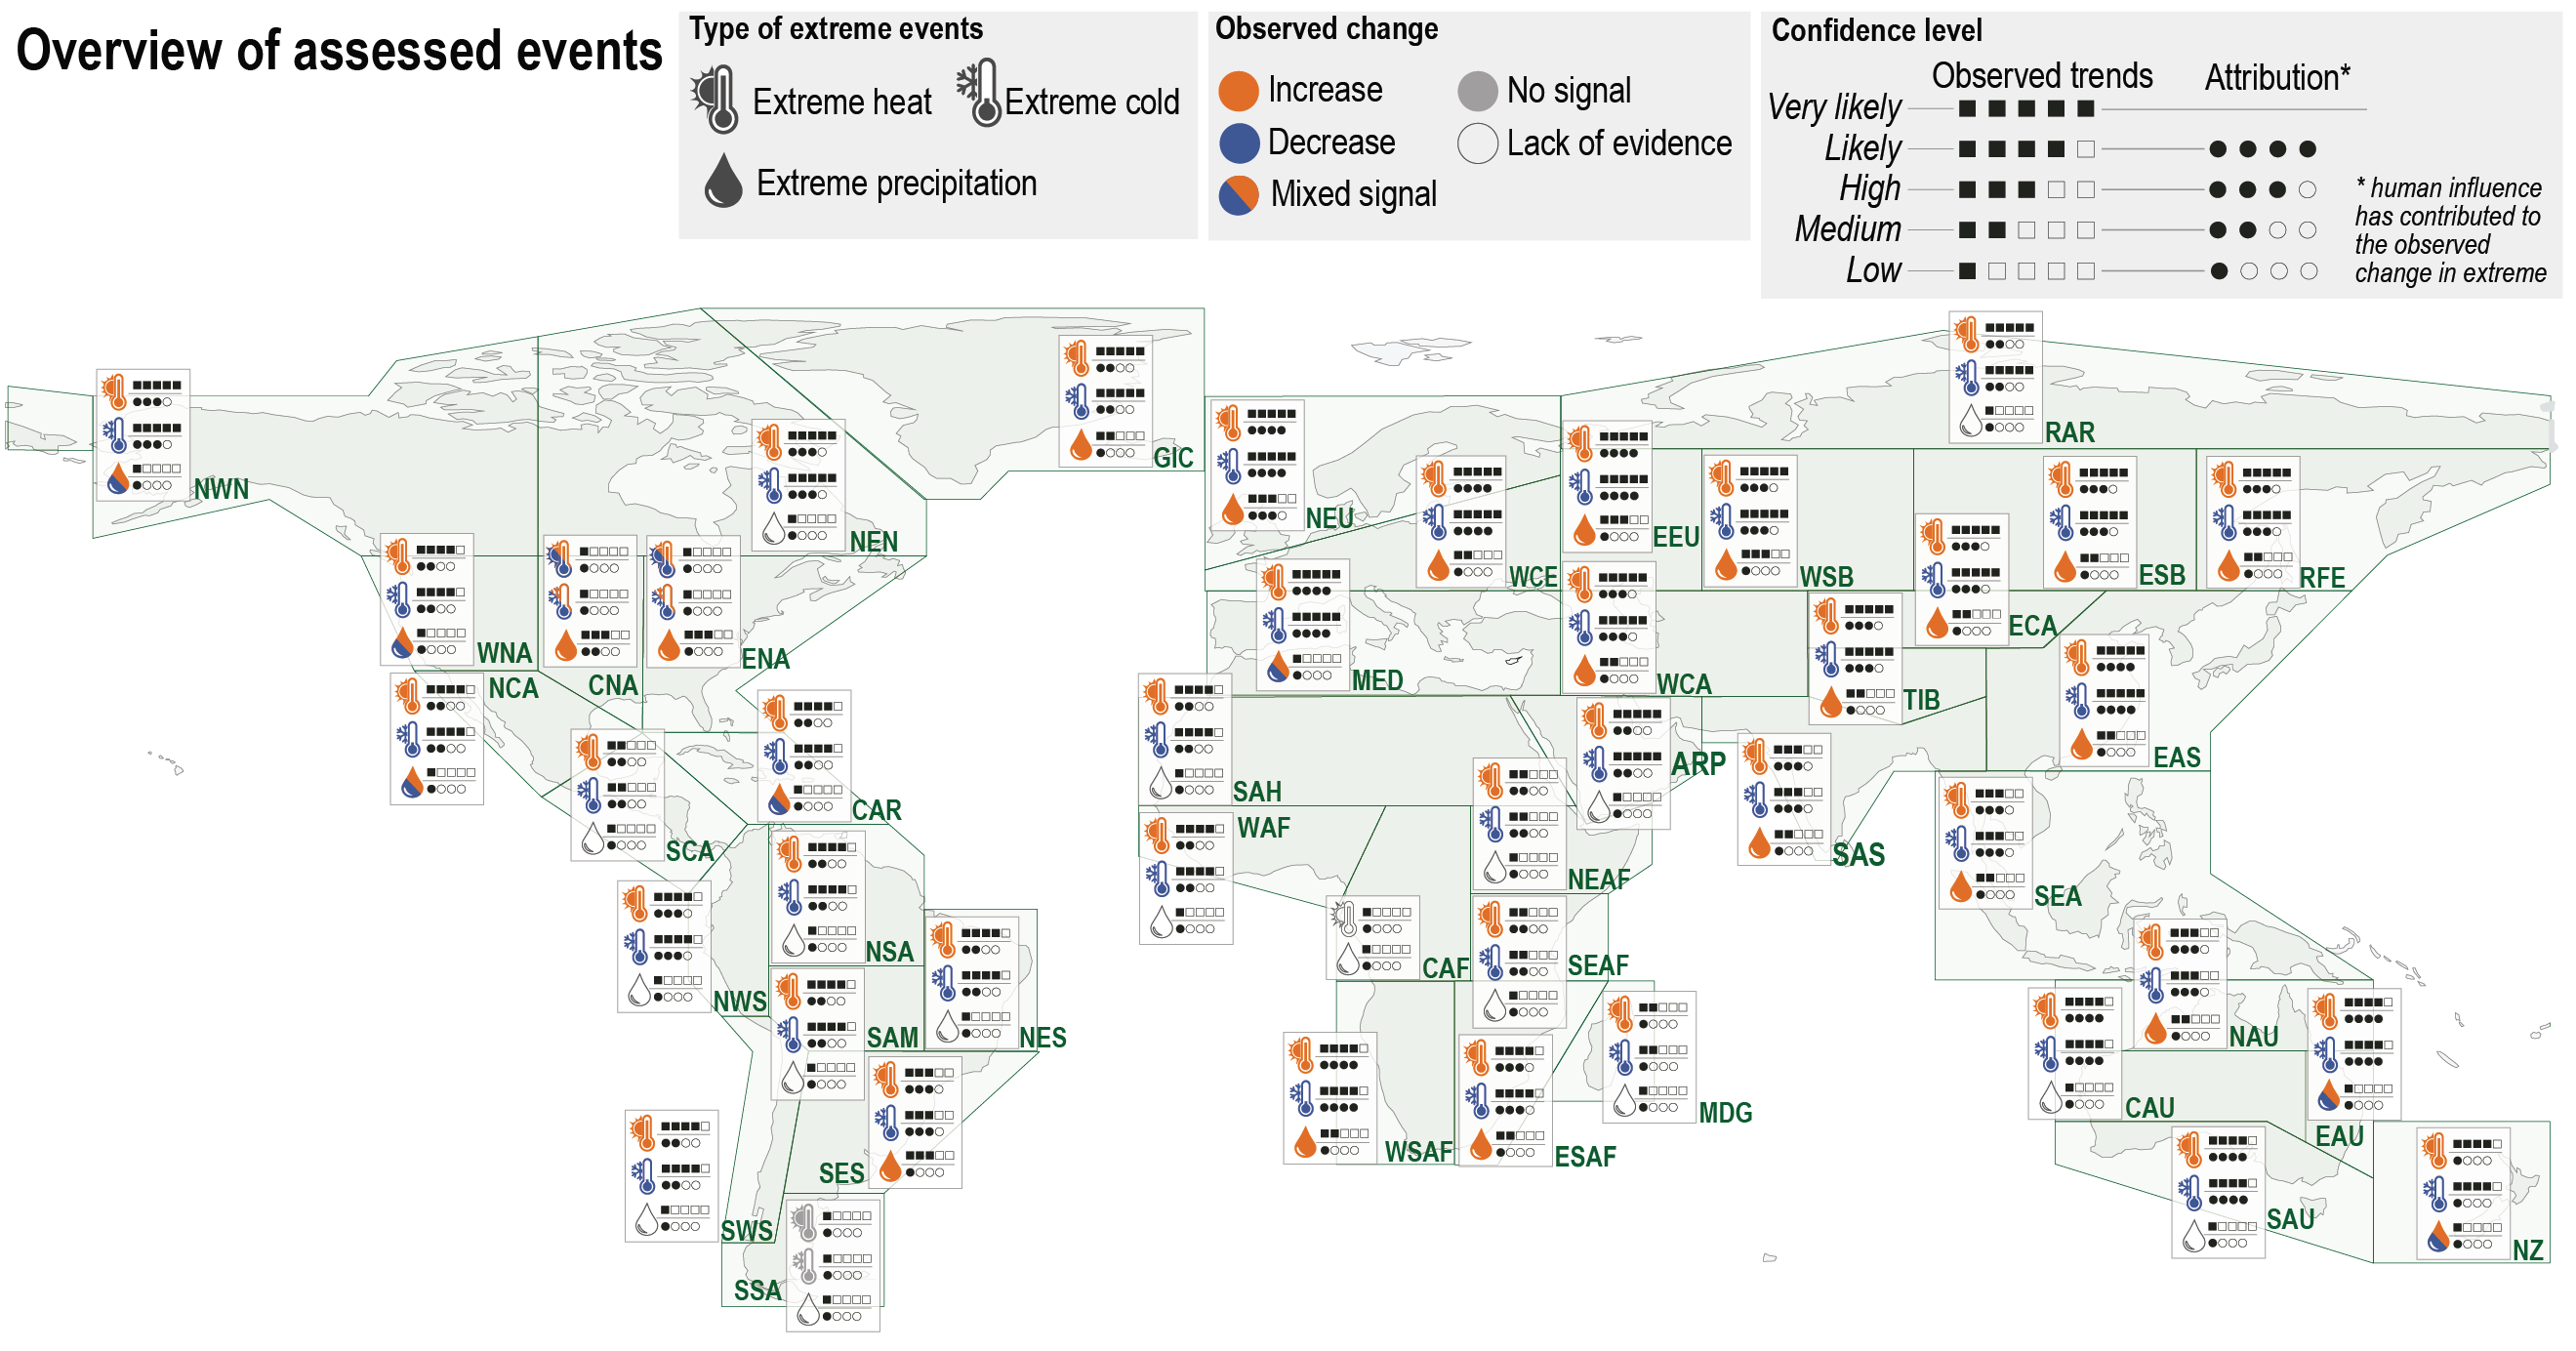
Figure caption
Figure 11.4 | Overview of observed changes for cold, hot, and wet extremes and their potential humancontribution. Shown are the direction of change and the confidence in: 1) the observed changes in cold and hot as well as wet extremes across the world; and 2) whether human-induced climate change contributed to causing these changes (attribution). In each region changes in extremes are indicated by colour (orange – increase in the type of extreme; blue – decrease; both colours – changes of opposing direction within the region, with the signal depending on the exact event definition; grey – there are no changes observed; and no fill – the data/evidence is too sparse to make an assessment). The squares and dots next to the symbol indicate the level of confidence for observing the trend and the human contribution, respectively. The more black dots/squares, the higher the level of confidence. The information on this figure is based on regional assessment of the literature on observed trends, detection and attribution and event attribution in Section 11.9.