Back chapter figures
Figure 11.8
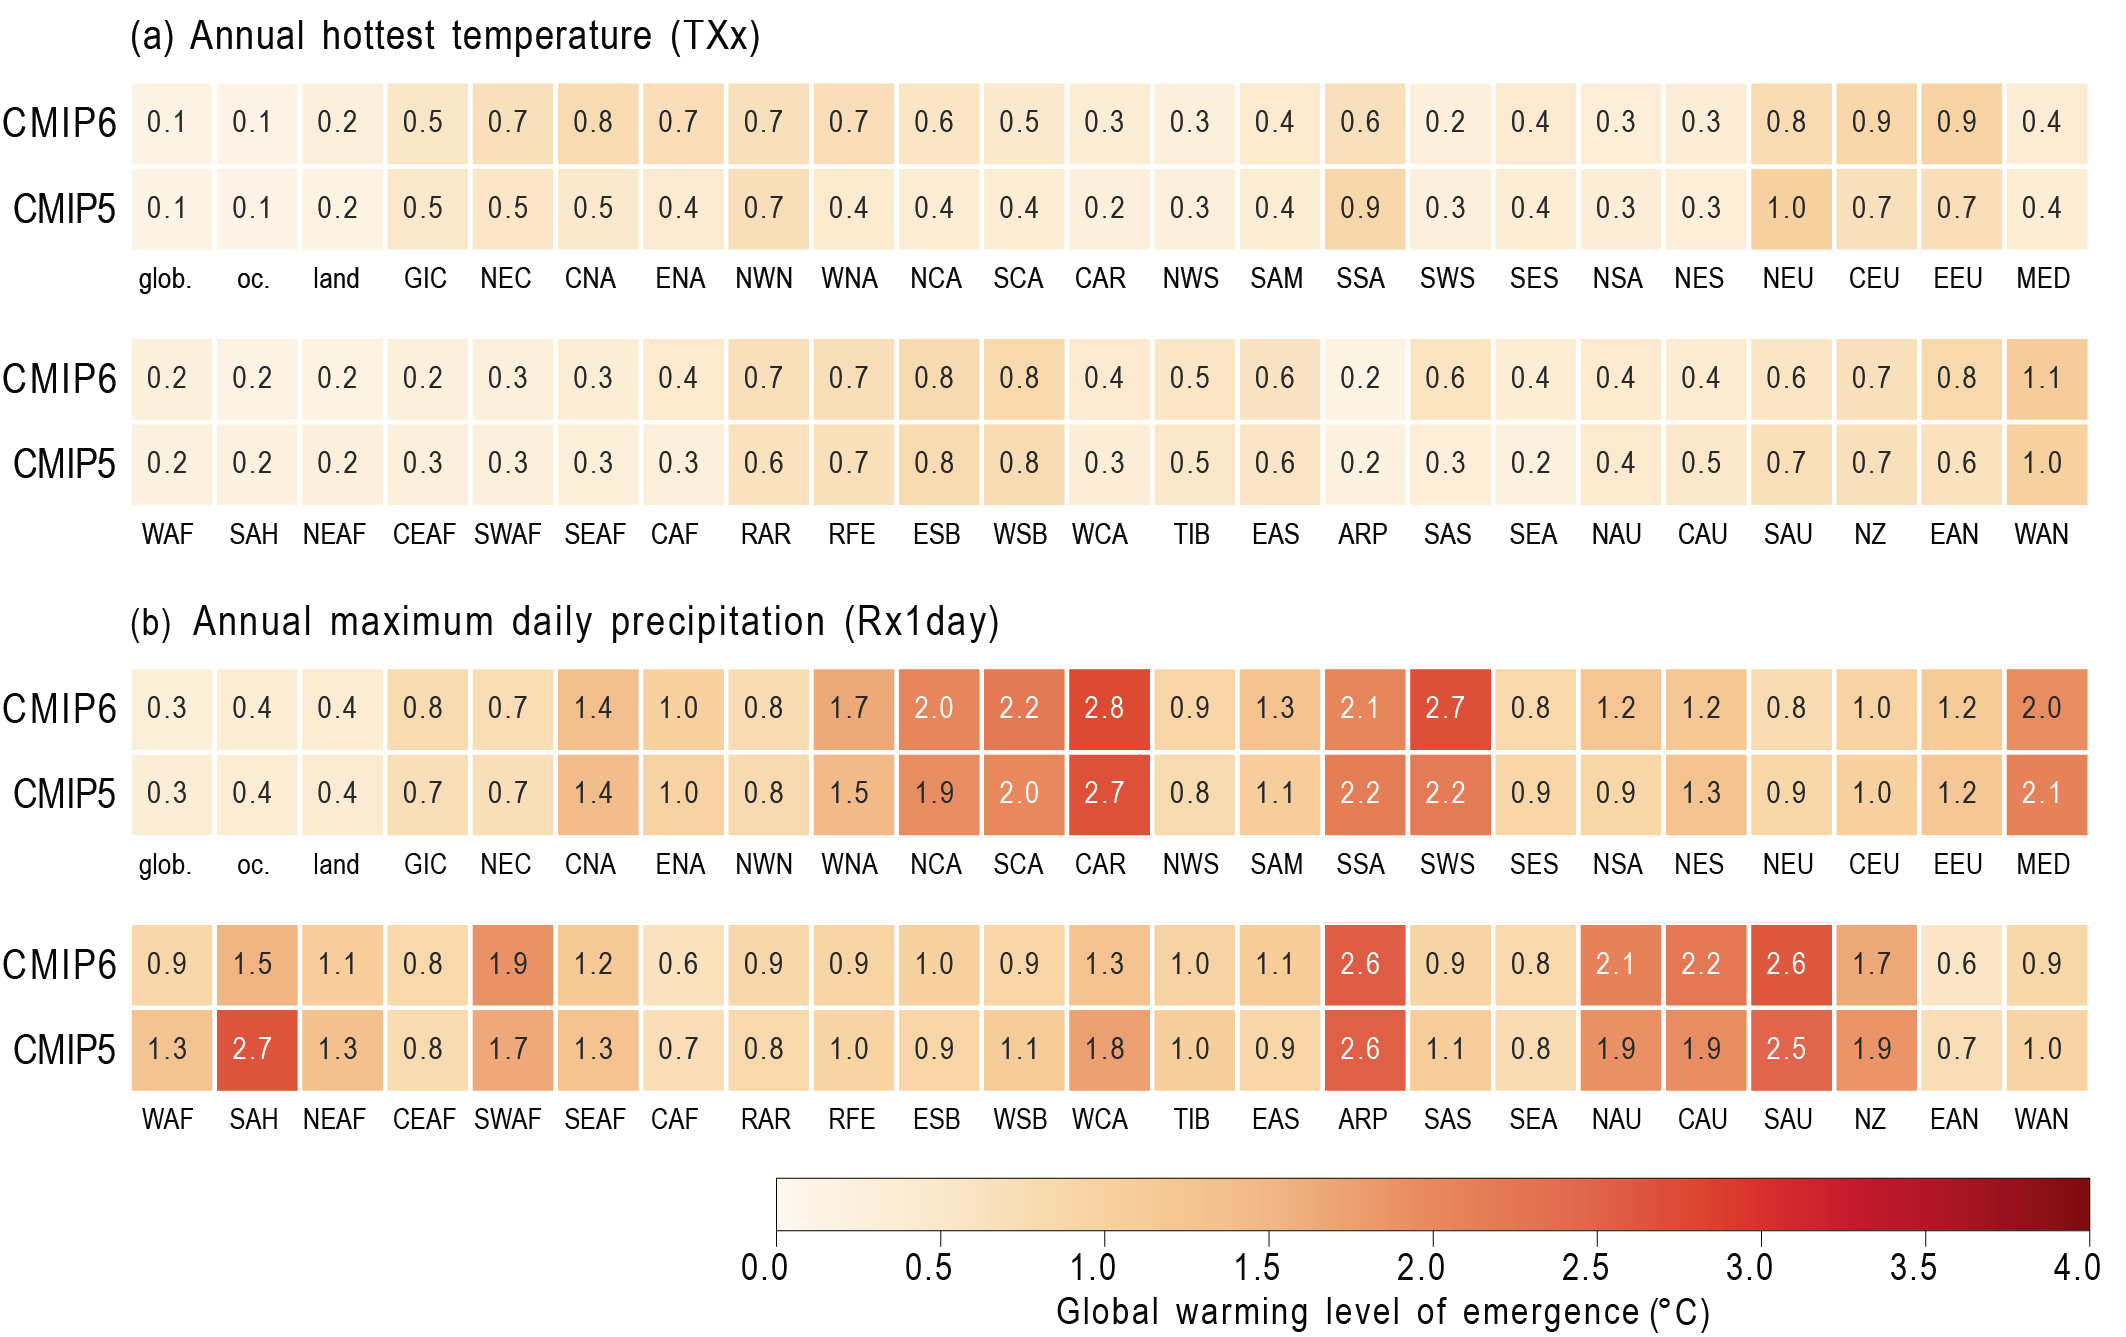
Figure caption
Figure 11.8 | Global and regional-scale emergence of changes in temperature (a) and precipitation (b) extremes for the globe (glob.), global oceans (oc.), global lands (land), and the AR6 regions. Colours indicate the multi-model mean global warming level at which the difference in 20-year means of the annual maximum daily maximum temperature (TXx) and the annual maximum daily precipitation (Rx1day) become significantly different from their respective mean values during the 1850–1900 base period. Results are based on simulations from the Coupled Model Intercomparison Project Phases 5 and 6 (CMIP5 and CMIP6) multi-model ensembles. See Atlas.1.3.2 for the definition of regions. Adapted from Seneviratne and Hauser (2020) under the terms of the Creative Commons Attribution licence.