Back chapter figures
Figure 11.9
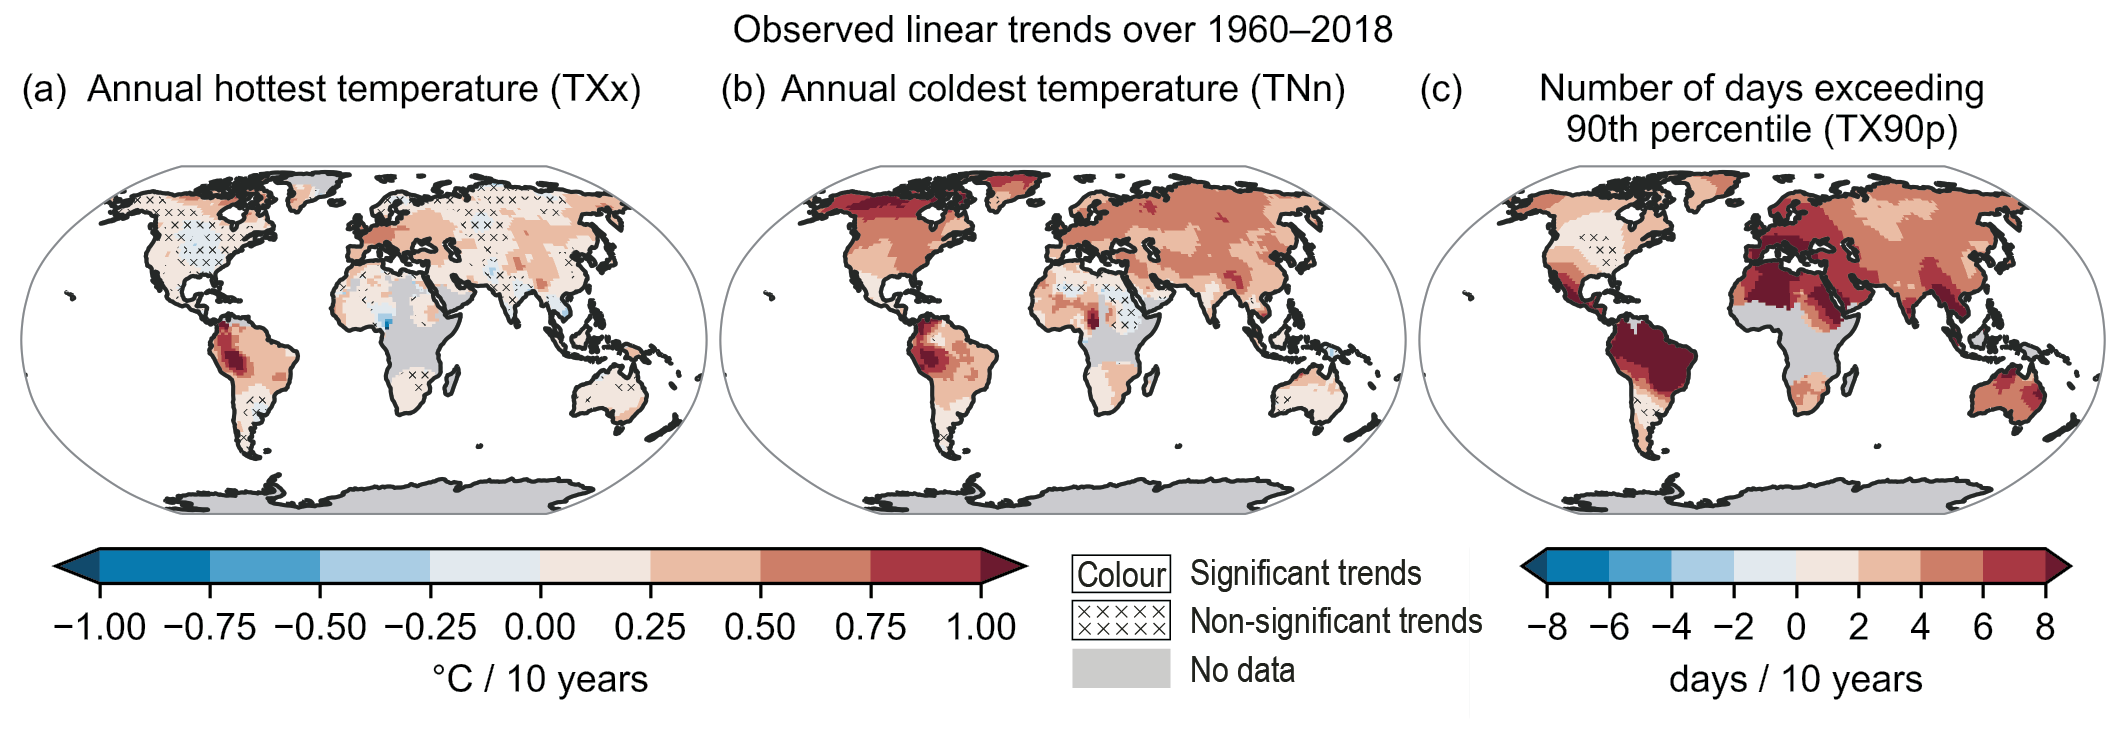
Figure caption
Figure 11.9 | Linear trends over 1960–2018 for three temperature ext reme indices: (a)the annual maximum daily maximum temperature (TXx), (b) the annual minimum daily minimum temperature (TNn), and (c) the annual number of days when daily maximum temperature exceeds its 90th percentile from a base period of 1961–1990 (TX90p); based on the HadEX3 dataset (Dunn et al. , 2020). Linear trends are calculated only for grid points with at least 66% of the annual values over the period and which extend to at least 2009. Areas without sufficient data are shown in grey. No overlay indicates regions where the trends are significant at the p = 0.1 level. Crosses indicate regions where trends are not significant. Further details on data sources and processing are available in the chapter data table (Table 11.SM.9).