Back chapter figures
FAQ 12.3 Figure 1
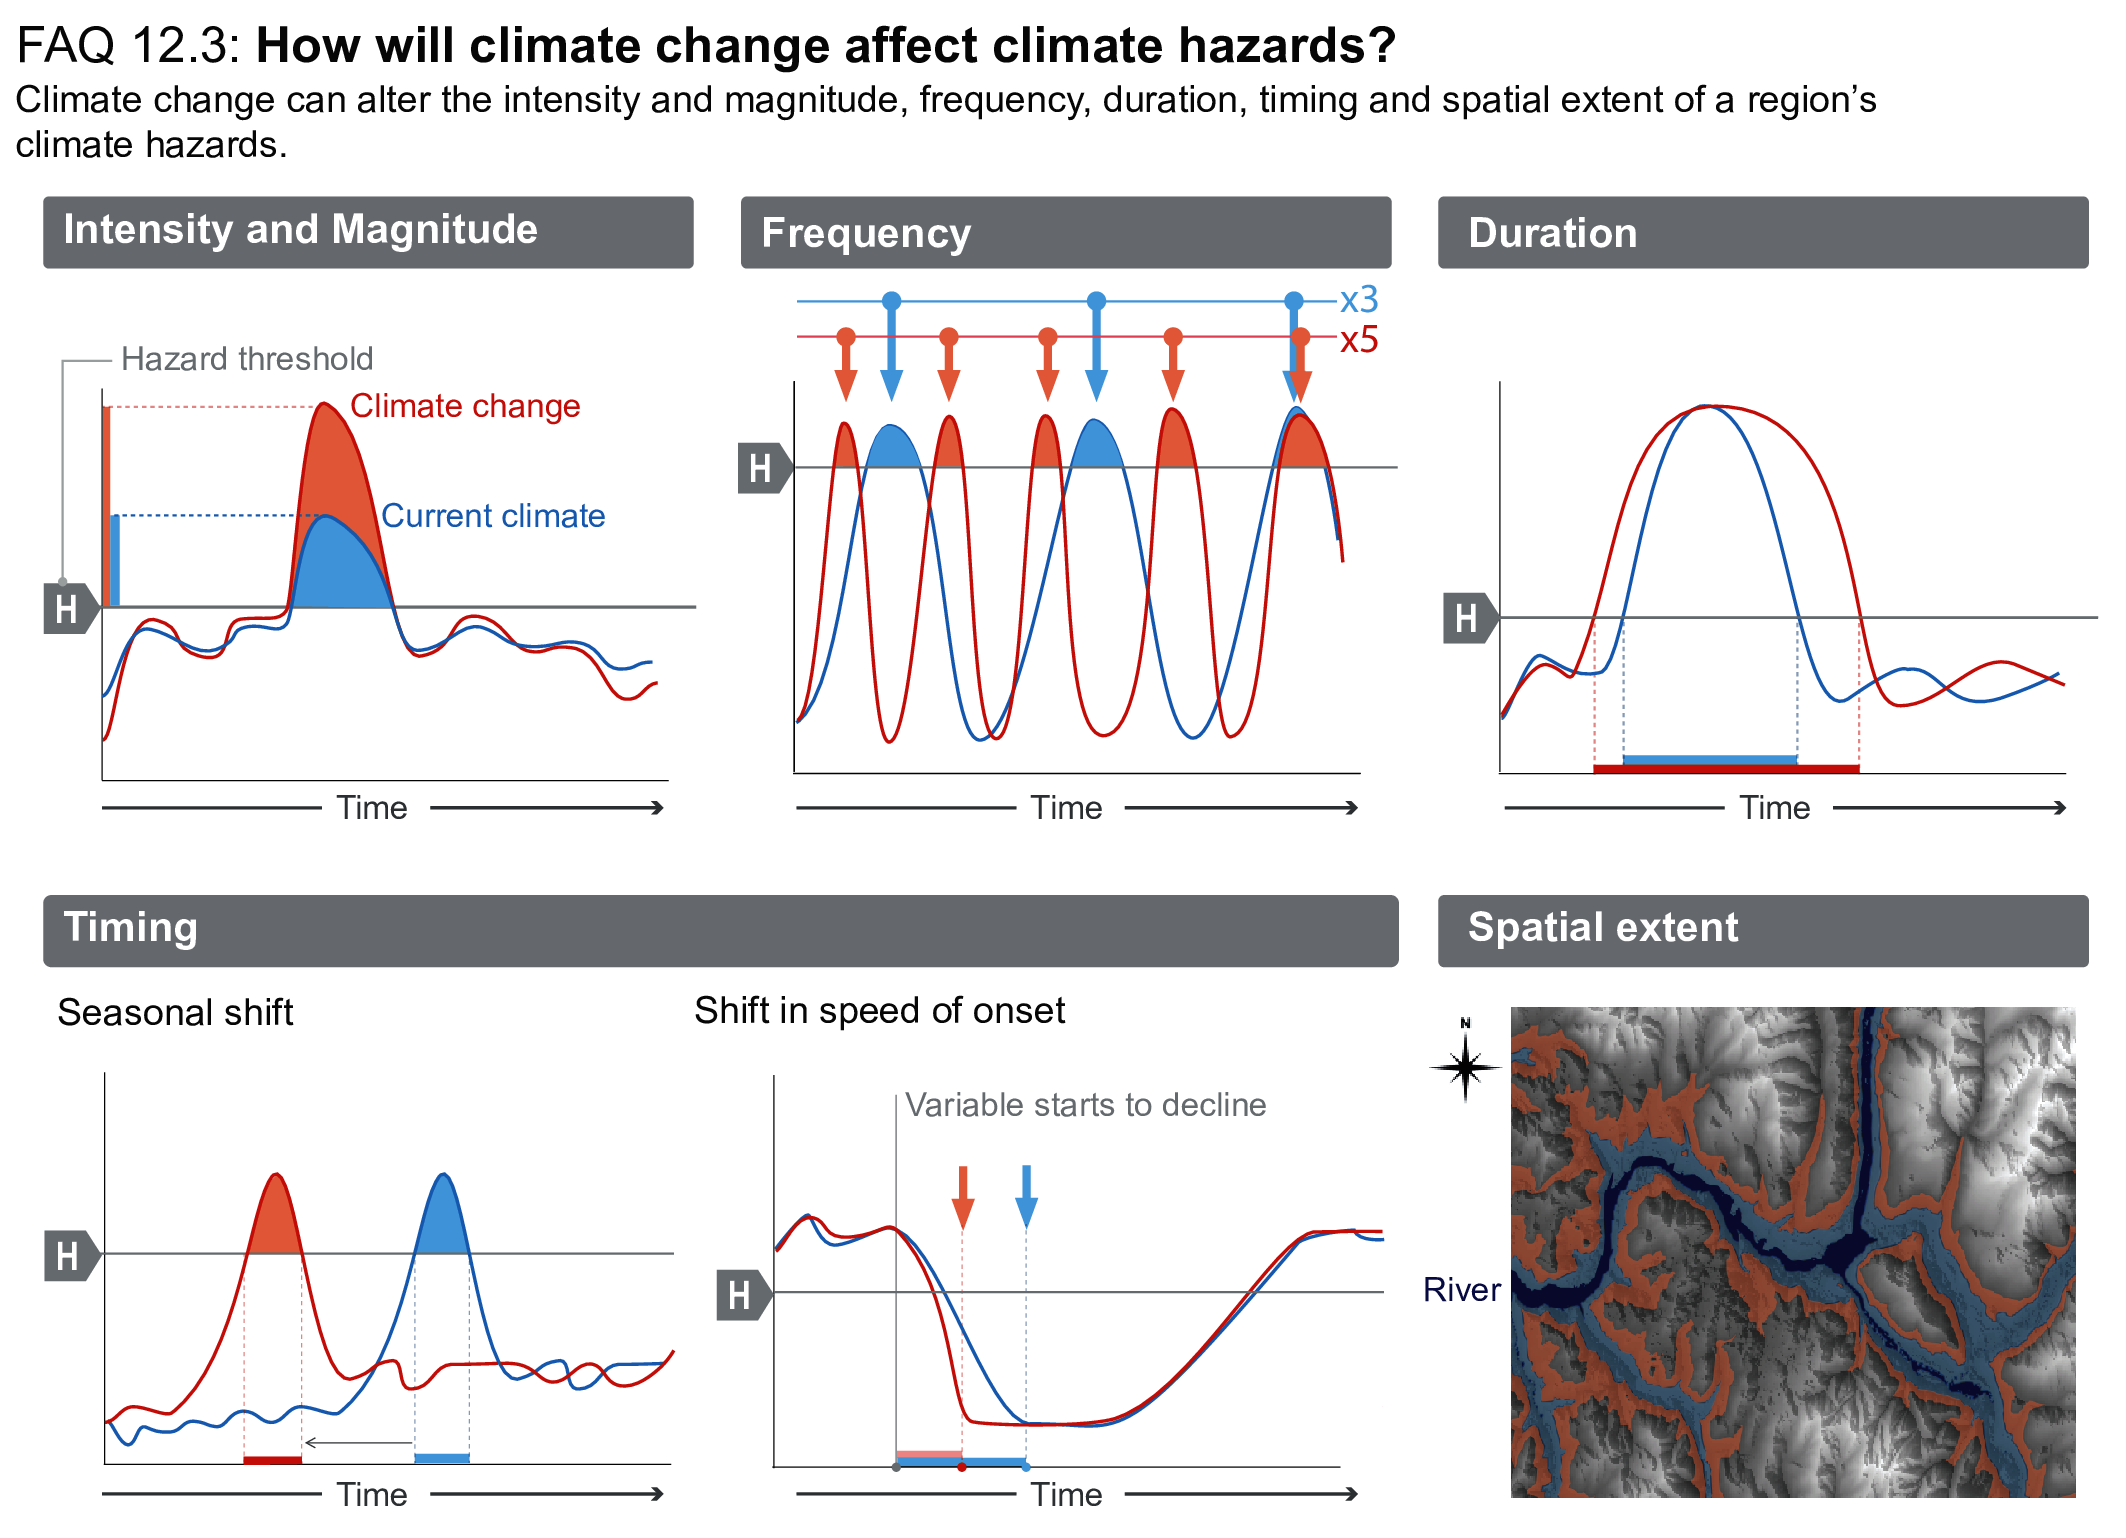
Figure caption
FAQ 12.3, Figure 1 | Types of changes to a region’s hazard profile. The first five panels illustrate how climate changes can alter a hazard’s intensity (or magnitude), frequency, duration, and timing (by seasonality and speed of onset) in relation to a hazard threshold (horizontal grey line, marked ‘H’). The difference between the historical climate (blue) and future climate (red) shows the changing aspects of climate change that stakeholders will have to manage. The bottom right-hand panel shows how a given climate hazard (such as a current once-in-100-year river flood, geographic extent in blue) may reach new geographical areas under a future climate change (extended area in red).