Back chapter figures
Figure 12.1
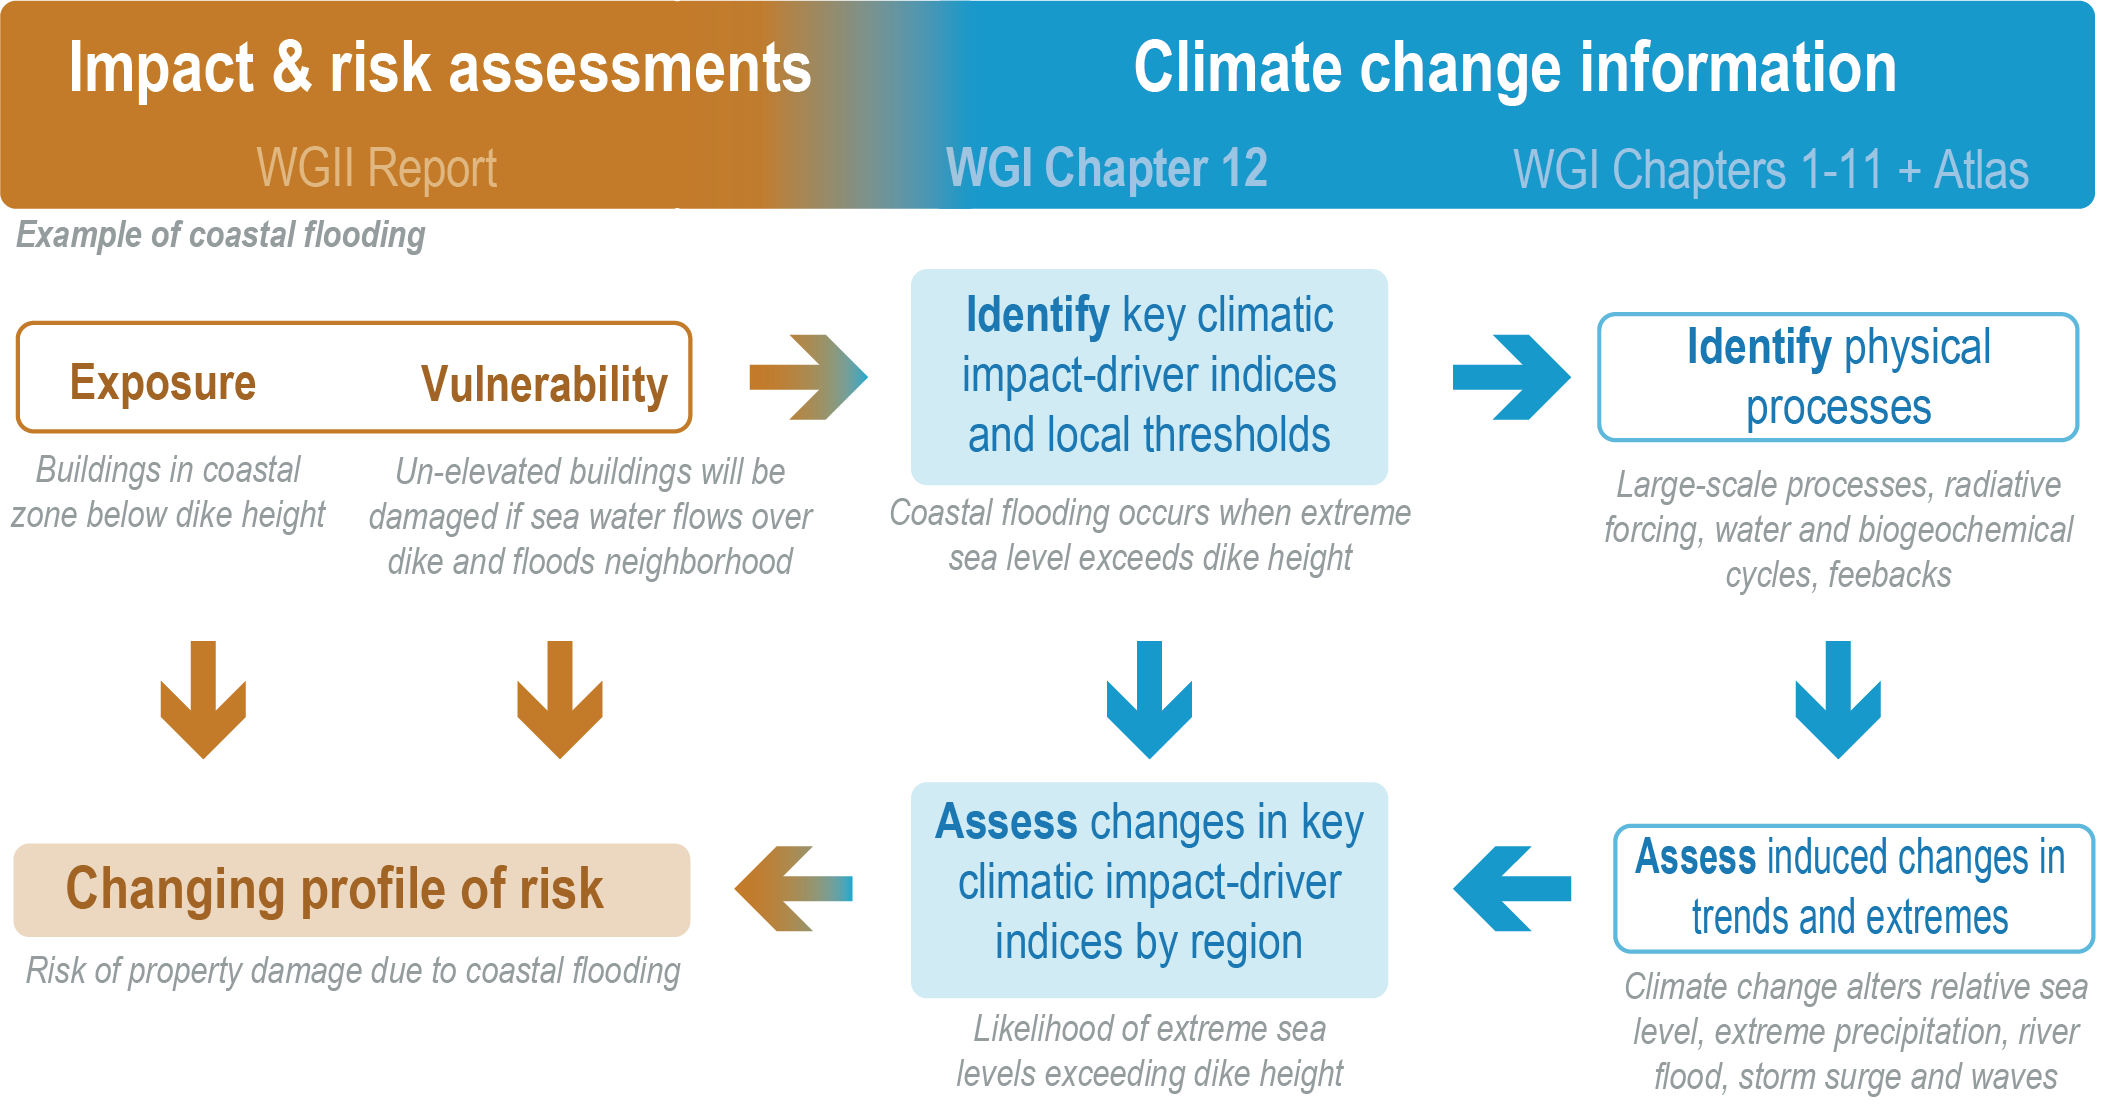
Figure caption
Figure 12.1 | Schematic diagram showing the use of climate change information (AR6 WGI chapters) for typical impacts or risk assessment (AR6 WGII chapters) and the role of Chapter 12, via an illustration of the assessment of property damage or loss in a particular region when extreme sea level exceeds dike height.