Back chapter figures
Figure 12.10
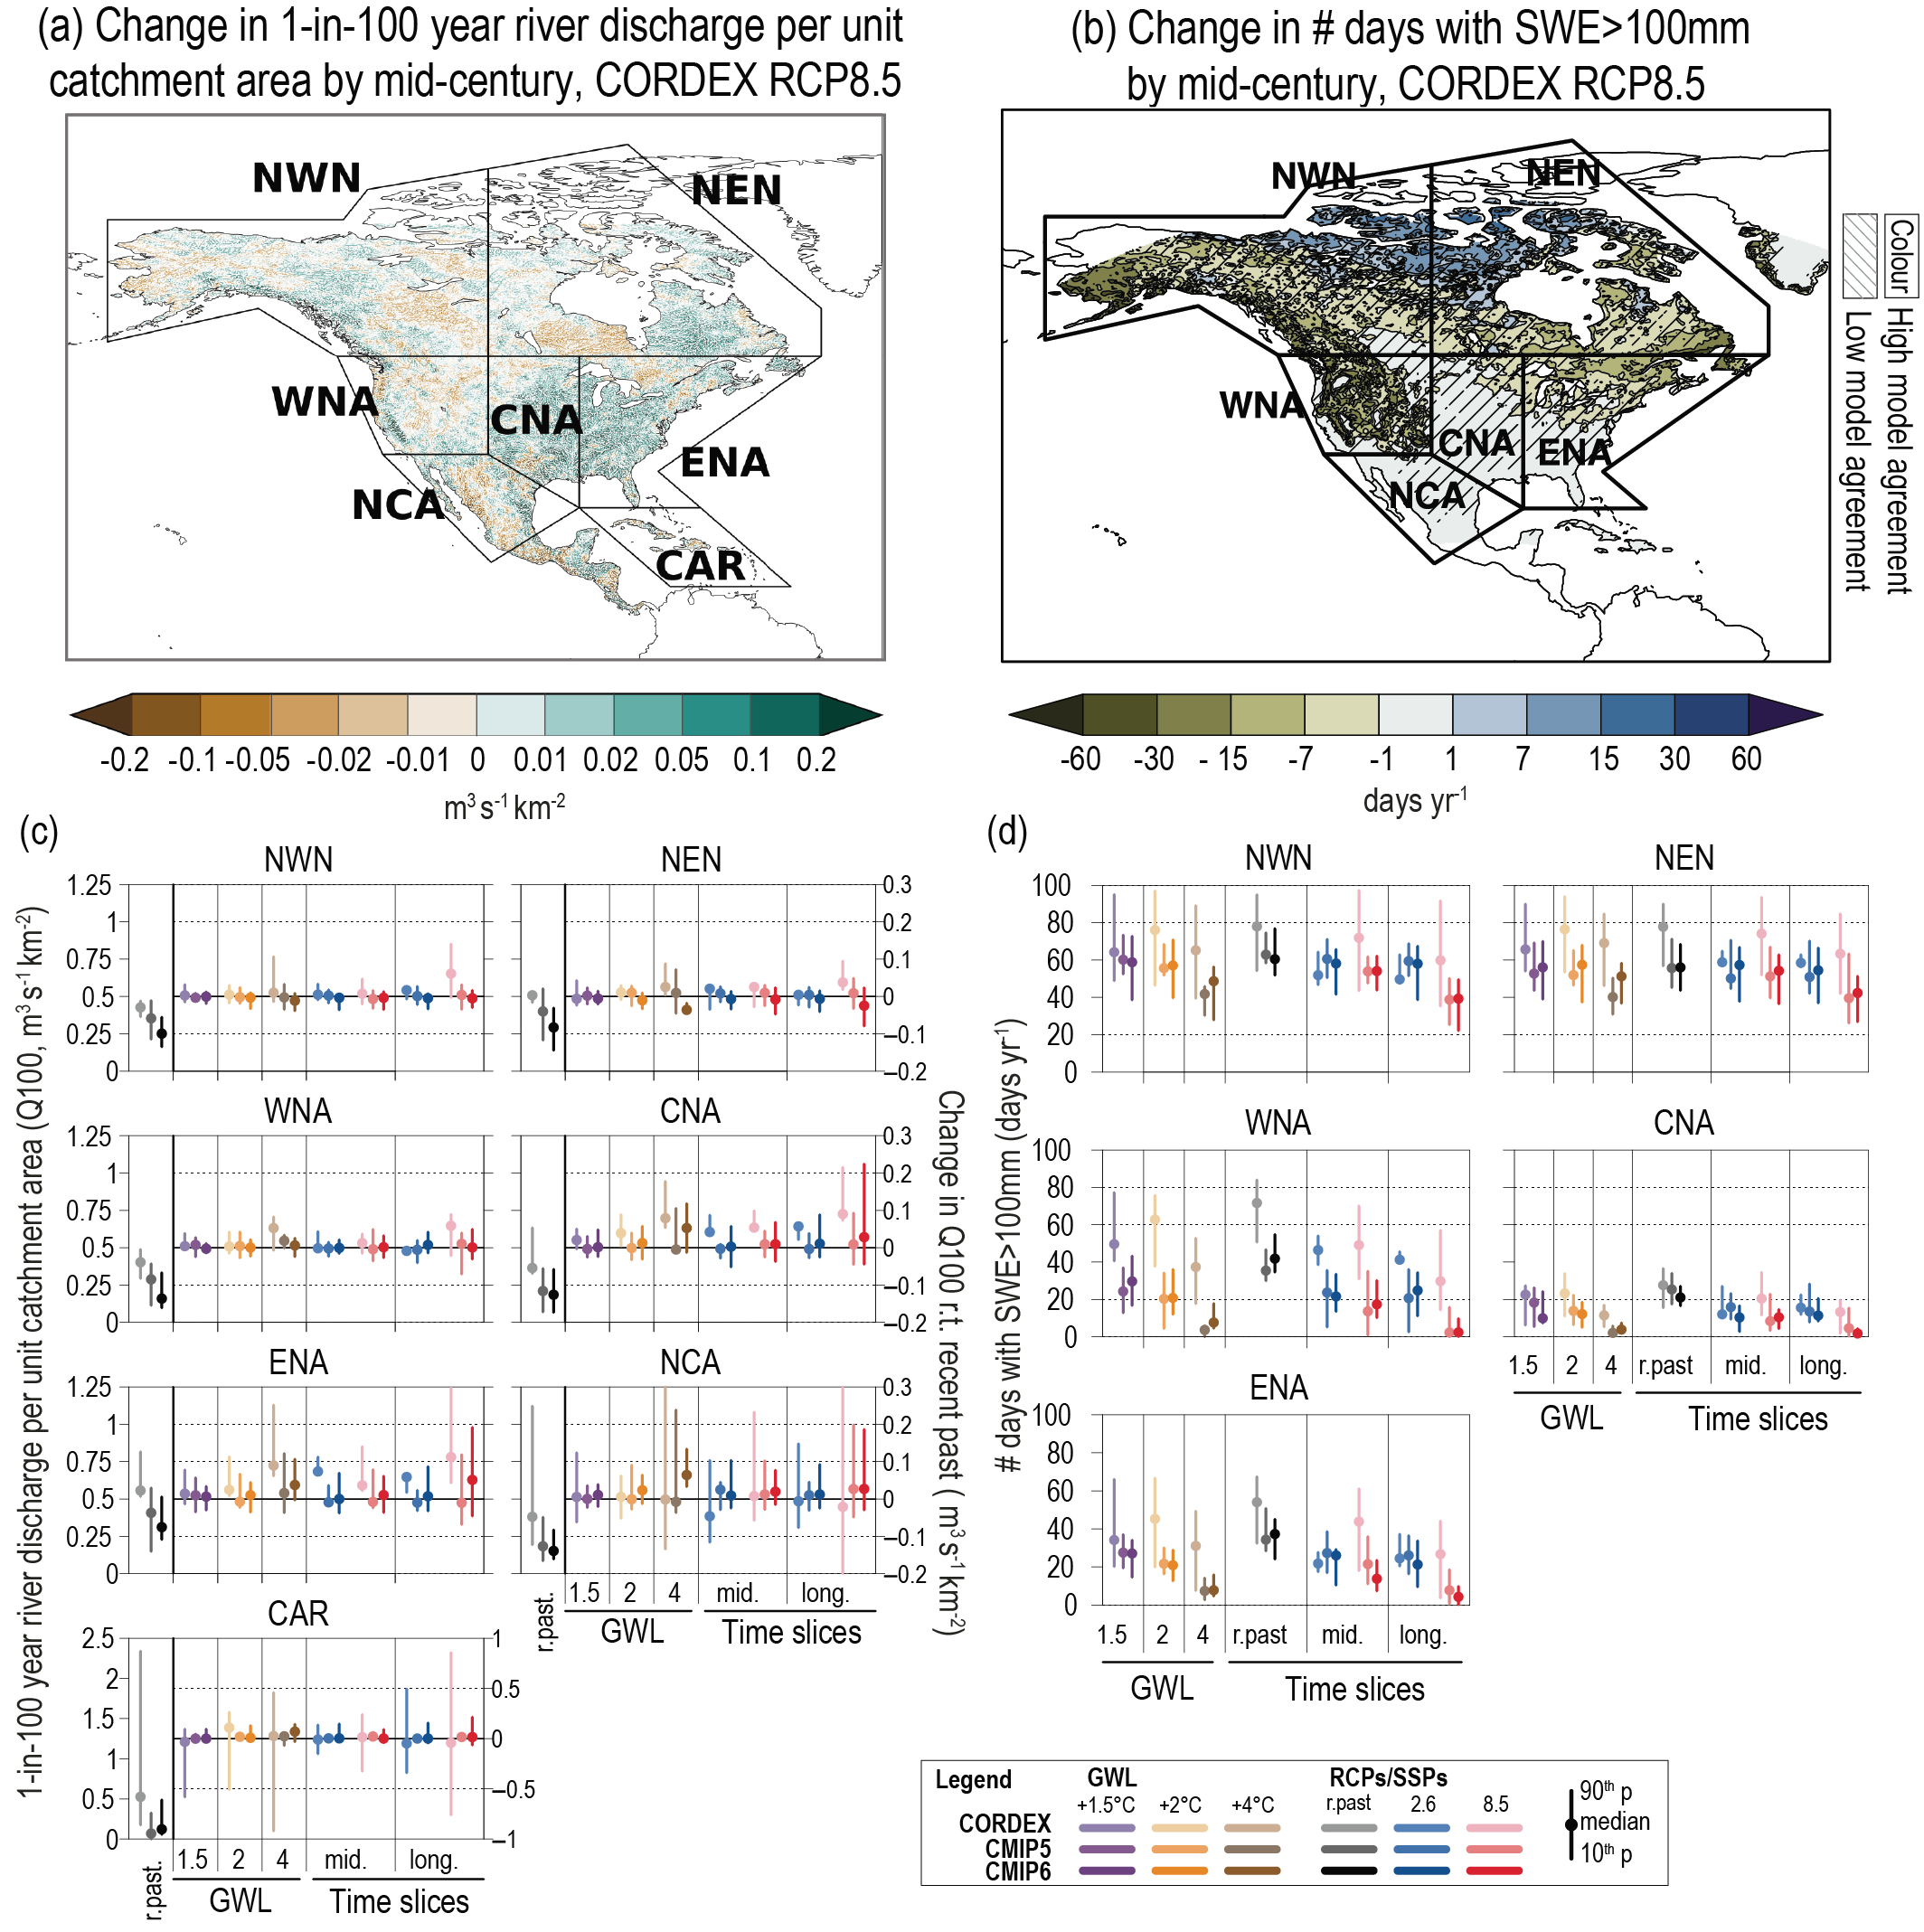
Figure caption
Figure 12.10 | Projected changes in selected climatic impact-driver indices for North America. (a) Mean change in 1-in-100-year river discharge per unit catchment area (Q100, m3s–1km–2), and (b) median change in the number of days with snow water equivalent (SWE) over 100 mm (from November to March), from CORDEX-North America models for 2041–2060 relative to 1995–2014 and RCP8.5. Diagonal lines indicate where less than 80% of models agree on the sign (direction) of change. (c) Bar plots for Q100 (m3s–1km–2) averaged over land areas for the AR6 WGI Reference Regions (defined in Chapter 1). The left-hand column within each panel (associated with the left-hand y-axis) shows the ‘recent past’ (1995–2014) Q100 absolute values in grey shades. The other columns (associated with the right-hand y-axis) show the Q100 changes relative to the recent past values for two time periods (‘mid’ 2041–2060 and ‘long’ 2081–2100) and for three global warming levels (defined relative to the pre-industrial period 1850–1900): 1.5°C (purple), 2°C (yellow) and 4°C (brown). The bars show the median (dots) and the 10–90th percentile range of model ensemble values across each model ensemble. CMIP6 is shown by the darkest colours, CMIP5 by medium, and CORDEX by light. SSP5-8.5/RCP8.5 is shown in red and SSP1-2.6/RCP2.6 in blue. (d) As for (c) but showing absolute values for number of days with SWE > 100 mm, masked to grid cells with at least 14 such days in the recent past. See Technical Annex VI for details of indices. A Caribbean (CAR) Q100 bar plot is included here but assessed in the Small Islands section Section 12.4.7). Further details on data sources and processing are available in the chapter data table (Table 12.SM.1).