Back chapter figures
Figure 12.11
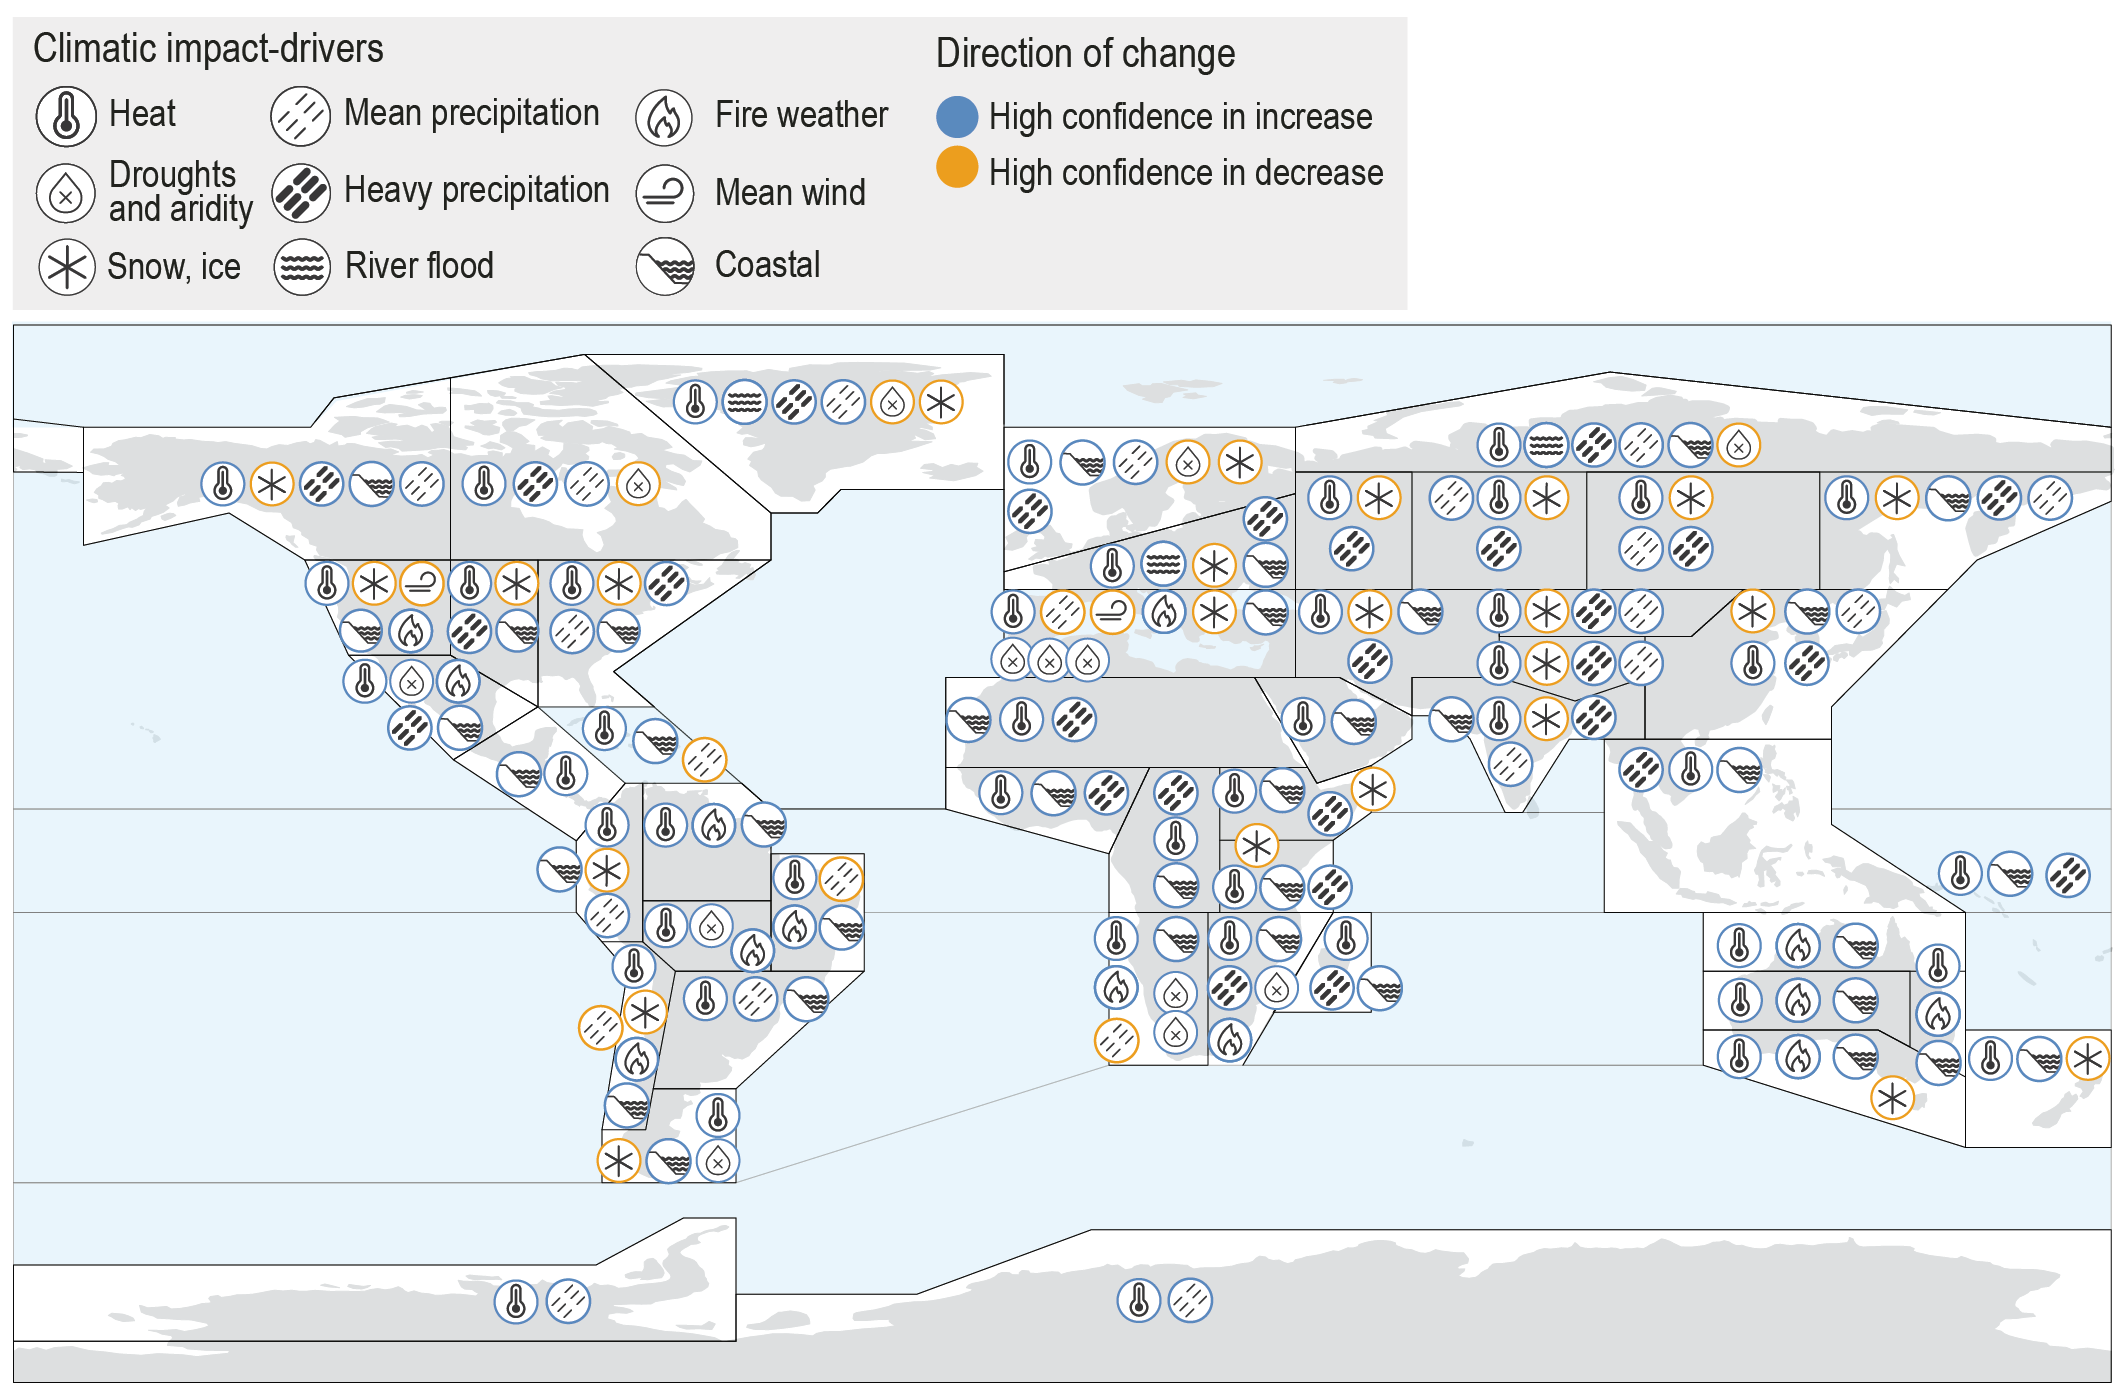
Figure caption
Figure 12.11 | Synthesis of the climatic impact-driver (CID) changes projected by 2050 (2041–2060) withhigh confidence, relative to reference period (1995–2014), together with the sign (direction) of change. Information is taken from the CID tables in Section 12.4. Some CIDs are grouped in order to streamline the information in order to fit in all information in the figure. Mean temperature, extreme heat, cold spells and frost are grouped under a single ‘heat’ icon, as they are projected to change simultaneously, albeit heat and cold are changing in opposite directions. Coastal CIDs (relative sea level, coastal flooding and coastal erosion at sandy beaches) are also grouped. In the figure, the ‘coastal’ icon indicates regions where at least two of the three individual coastal CIDs are projected to change with high confidence. Cases where only two of the three CIDs increase with high confidence are in Arctic Northern Europe, Russian Arctic and Arctic North-Western North America. A single icon is used for aridity, hydrological drought, and agricultural and ecological drought, and only the number of drought types that change is indicated. For the ‘Snow, ice’ icon, information is taken from the evolution of the ‘Snow, glacier and ice sheet’ CID; most regions also have similar changes for ‘permafrost’ and ‘lake, river and sea ice’. Exceptions are for North-Eastern North America, Russian Arctic and Arctic North-Western North America where snow is decreasing with medium confidence (thus not appearing in the figure), while permafrost and lake, river and sea ice is decreasing with high confidence. The location of the icons within the regions is arbitrary. Icon sources: https://www.flaticon.com/authors/freepik.