Figure 12.4
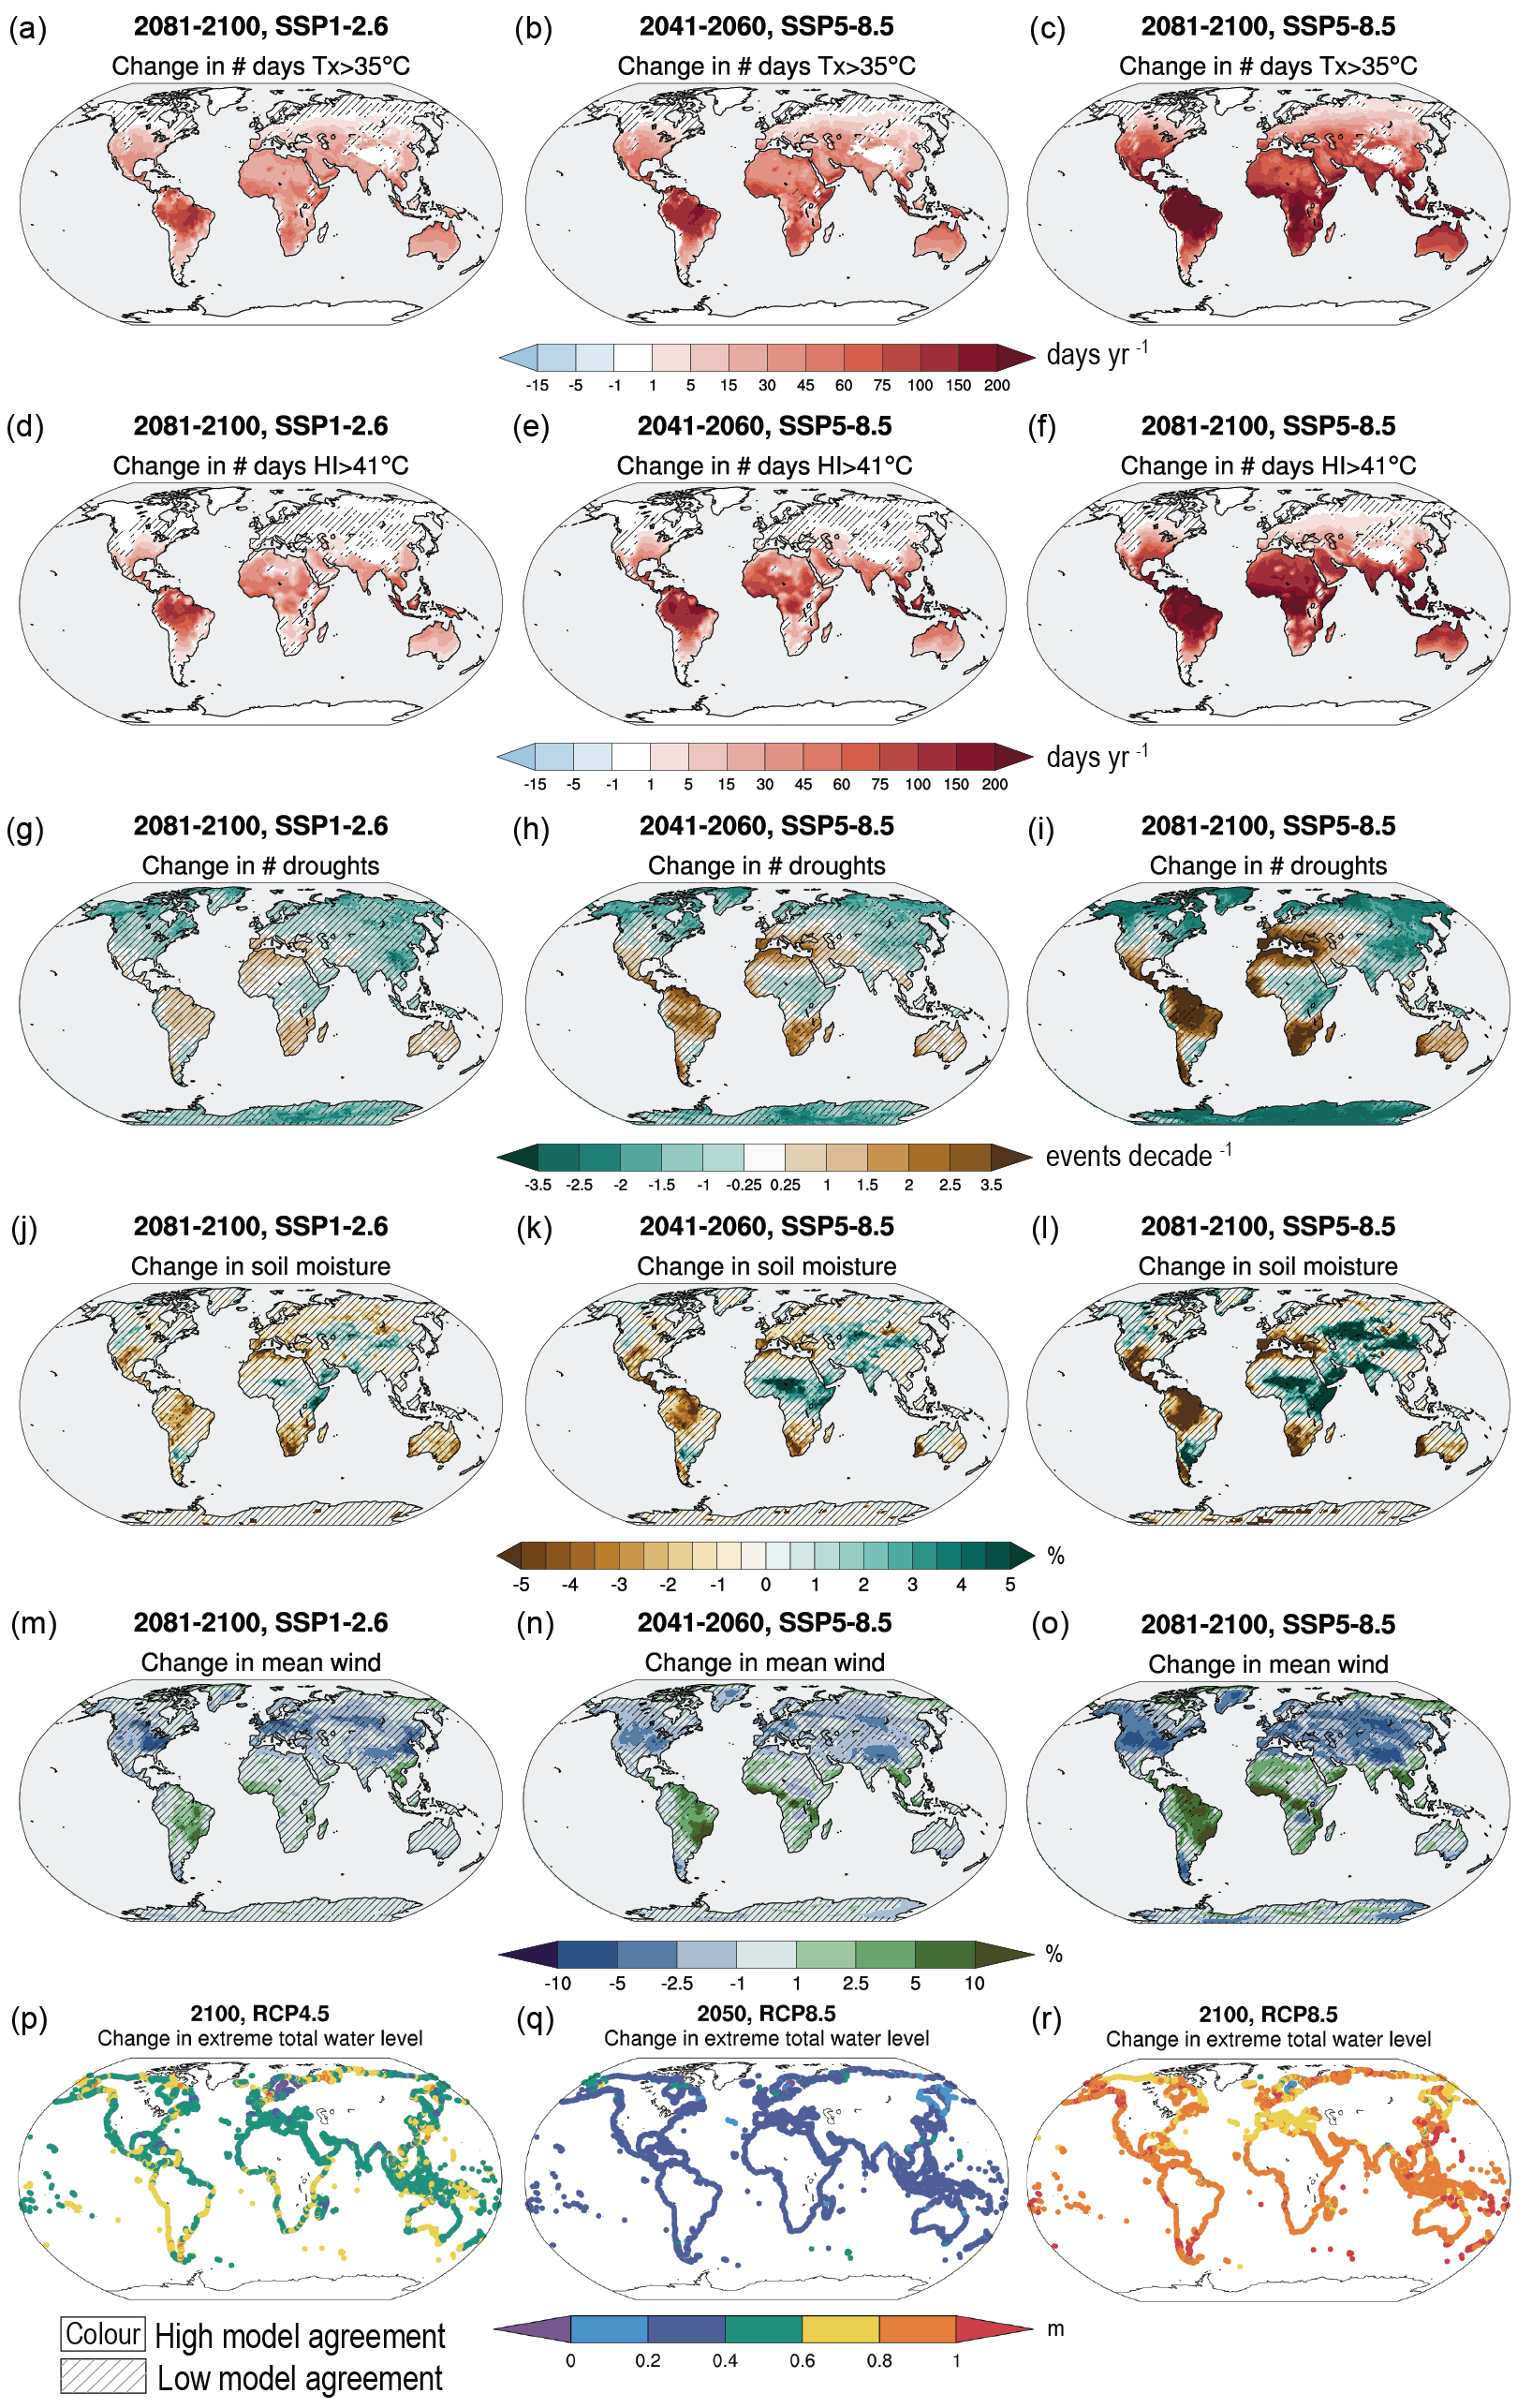
Figure caption
Mean number of days per year with maximum temperature exceeding 35°C; (d–f) mean number of days per year with the NOAA Heat Index (HI) exceeding 41°C; (g–i) number of negative precipitation anomaly events per decade using the six-month Standardized Precipitation Index; (j–l) mean soil moisture (%) and (m–o) mean wind speed (%). (p–r) shows change in extreme sea level (1-in-100-year return period total water level from Vousdoukas et al. (2018)’s CMIP5 based dataset; metres). Left-hand column is for SSP1-2.6, 2081–2100; middle column is for SSP5-8.5 2041–2060; and right-hand column SSP5-8.5, 2081–2100, all expressed as changes relative to 1995–2014. Exception is extreme total water level which is for (p) RCP4.5 2100, (q) RCP8.5 2050 and (r) RCP8.5 2100, each relative to 1980–2014. Bias correction is applied to daily maximum temperature and HI data (Atlas.1.4.5). Uncertainty is represented using the simple approach: no overlay indicates regions with high model agreement, where ≥80% of models agree on the sign (direction) of change; diagonal lines indicate regions with low model agreement, where <80% of models agree on the sign of change. For more information on the simple approach, please refer to the Cross-Chapter Box Atlas.1. See Annex VI for details of indices. Figures 12.SM.1–12.SM.6 show regionally averaged values of these indices for the AR6 WGI Reference Regions for various model ensembles, scenarios, time horizons and global warming levels. Further details on data sources and processing are available in the chapter data table (Table 12.SM.1).