Cross-chapter Box 2.3, Figure 1
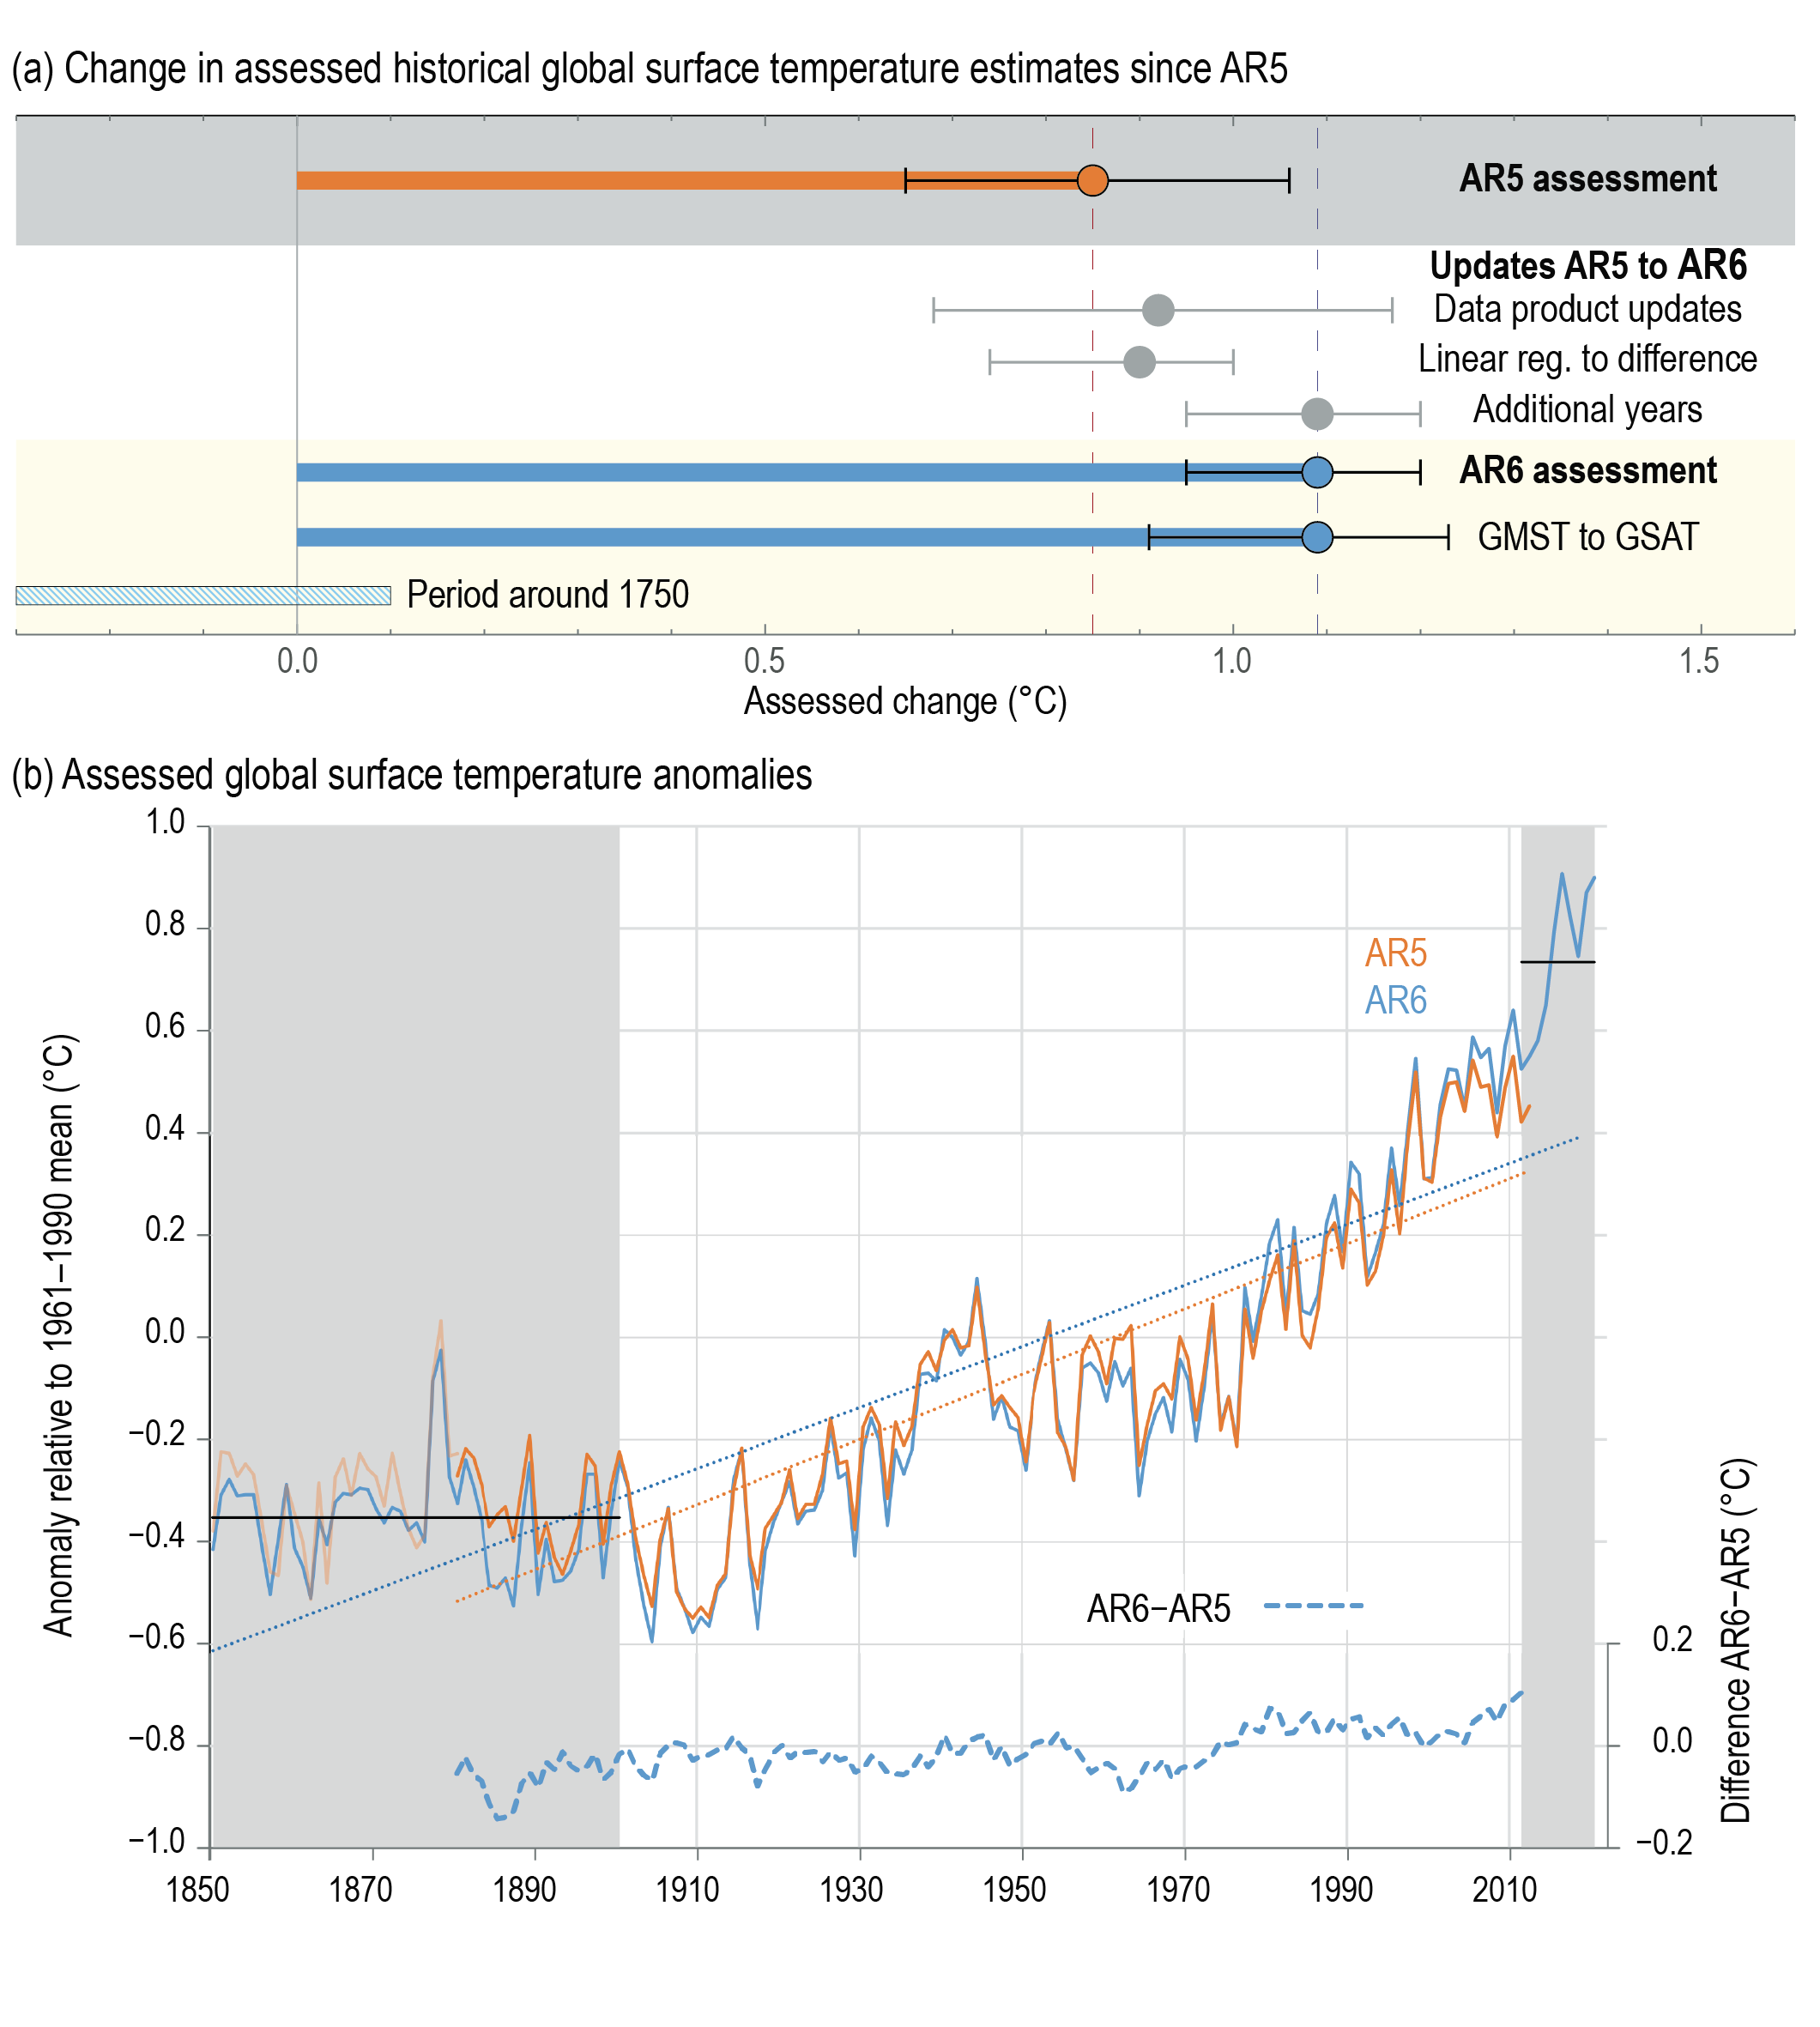
Figure caption
Cross-chapter Box 2.3, Figure 1 | Changes in assessed historical surface temperature changes since AR5. (a) Summary of the impact of various steps from AR5 assessment warming-to-date number for 1880–2012 using a linear trend fit to the AR6 assessment based upon the difference between 1850–1900 and 2011–2020. Whiskers provide 90% (very likely) ranges. AR6 assessment in addition denotes additional warming since the period around 1750 (Cross-Chapter Box 1.2). (b) Time series of the average of assessed AR5 series (orange, faint prior to 1880 when only HadCRUT4 was available) and AR6 assessed series (blue) and their differences (offset) including an illustration of the two trend fitting metrics used in AR5 and AR6. Further details on data sources and processing are available in the chapter data table (Table 2.SM.1).