Cross-Chapter Box 2.4, Figure 1
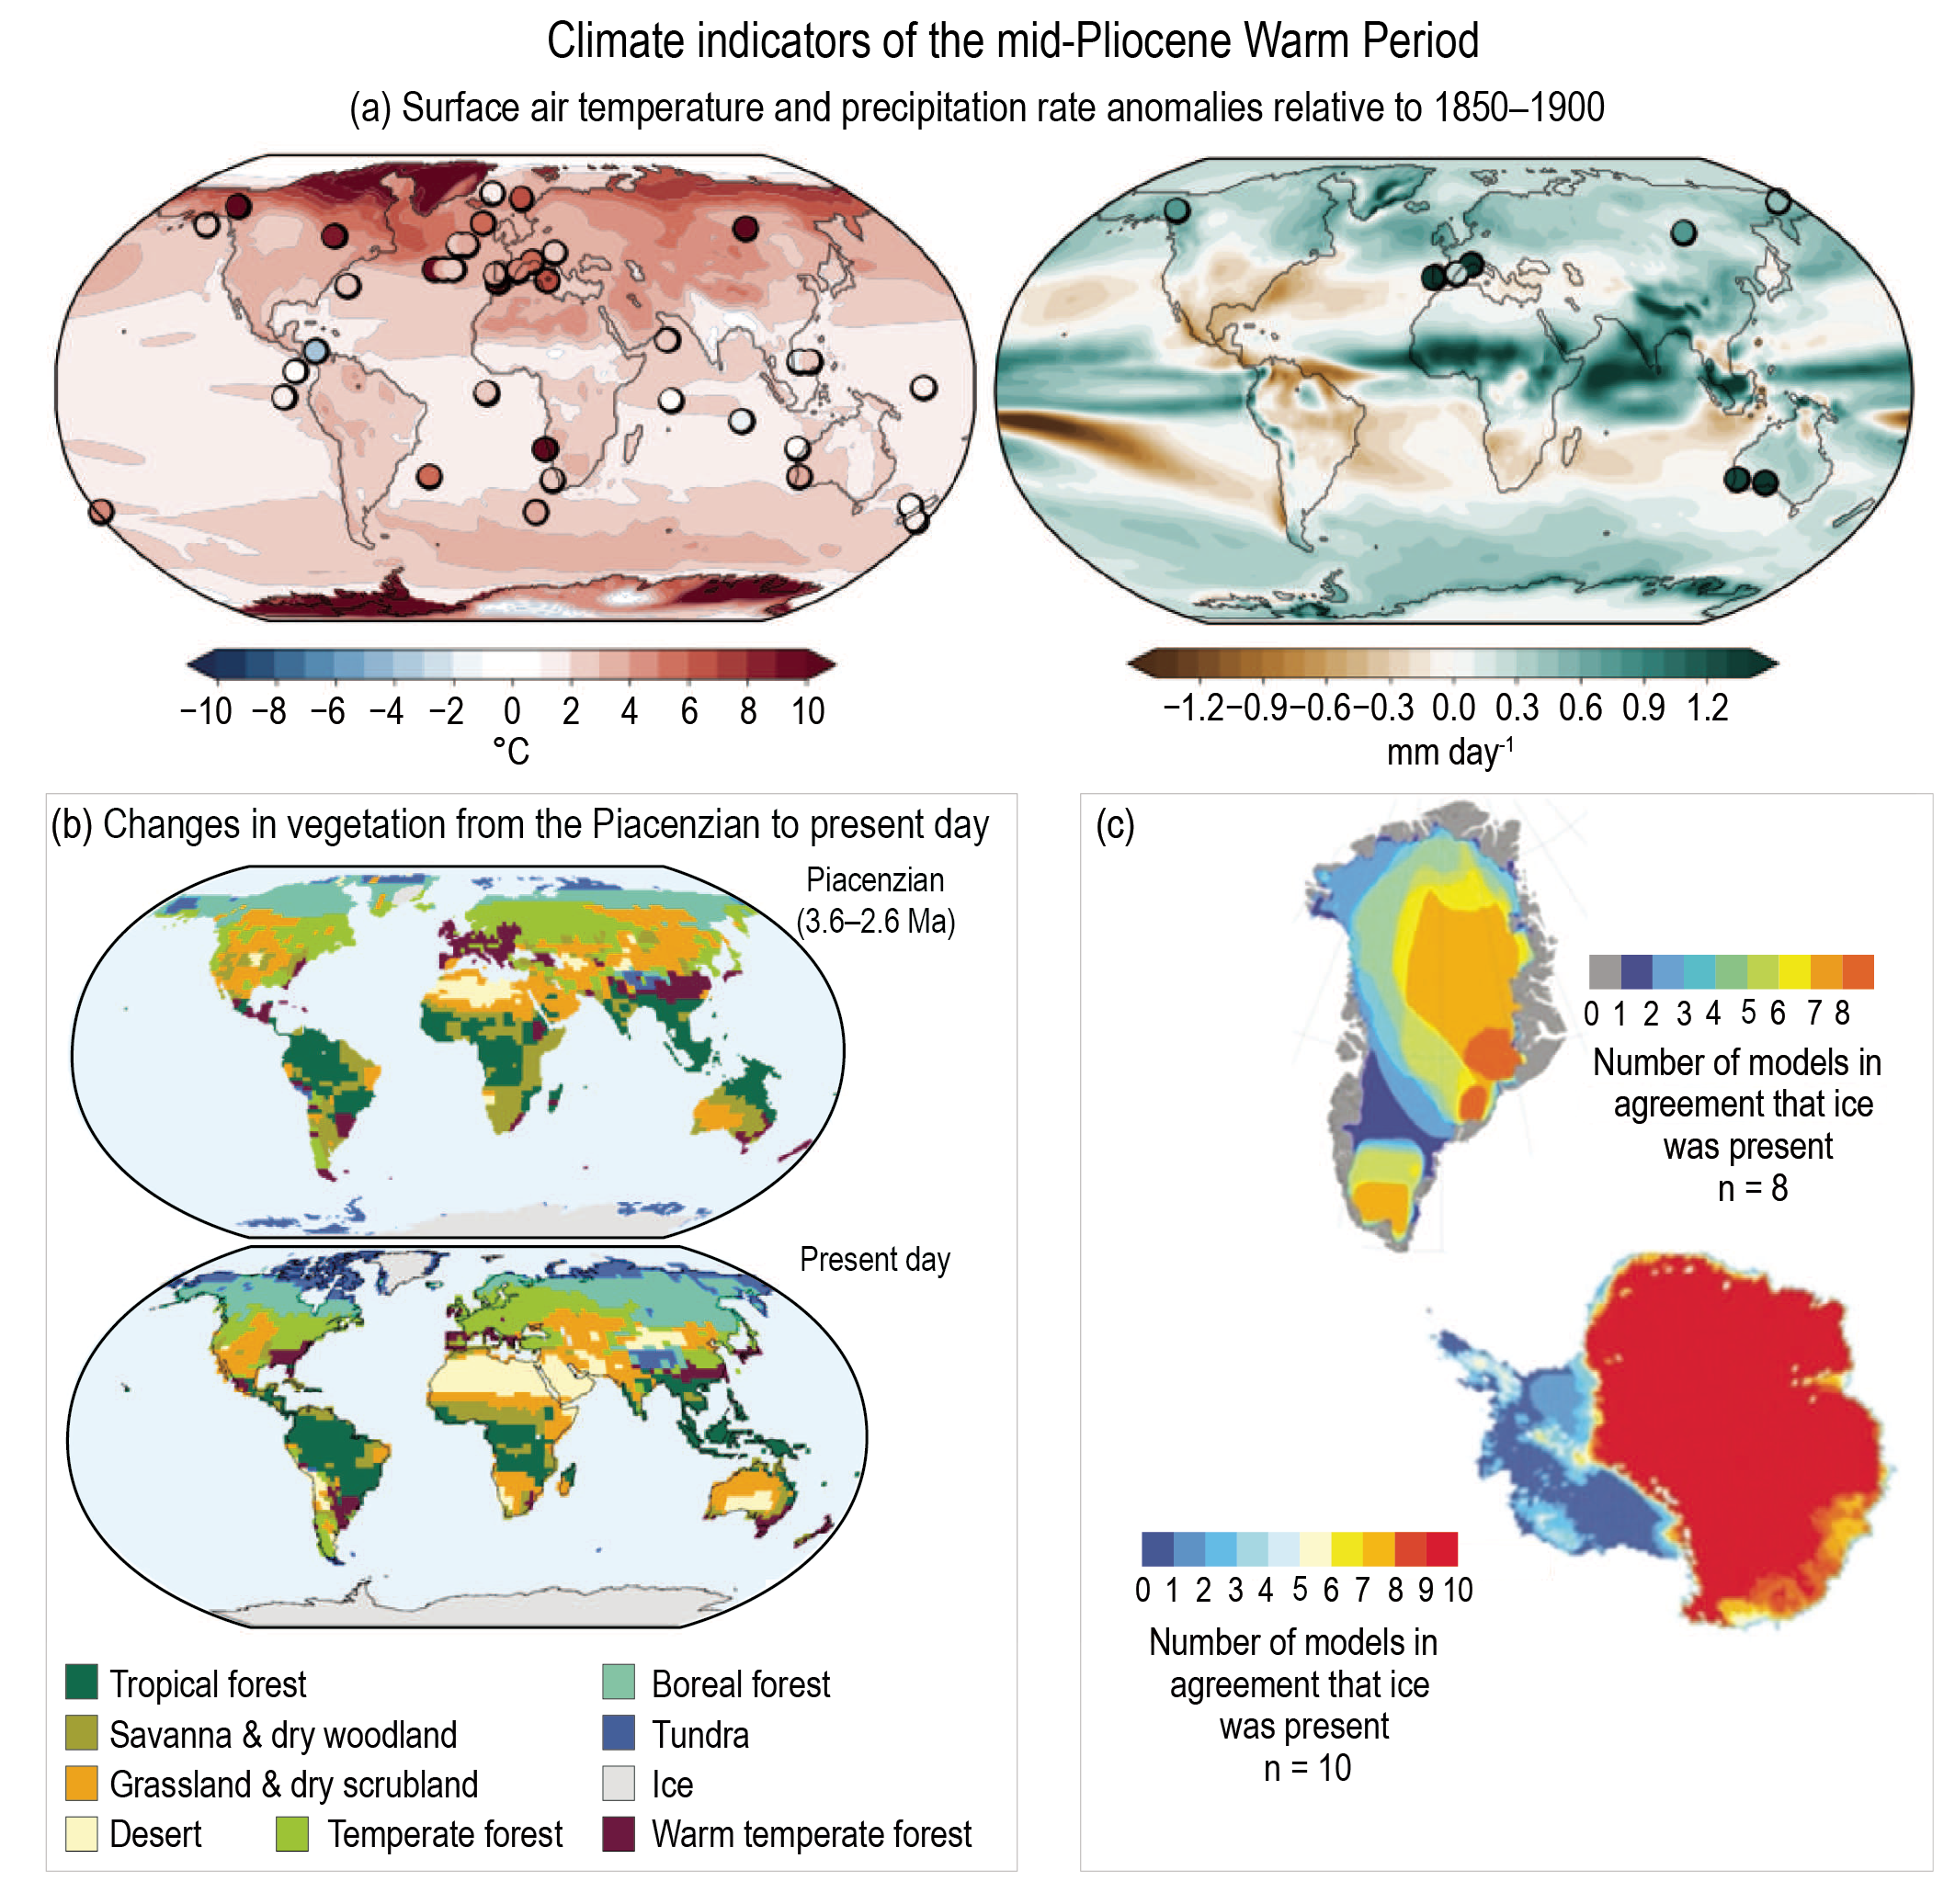
Figure caption
Cross-Chapter Box 2.4, Figure 1 | Climate indicators of the mid-Pliocene Warm Period (MPWP; 3.3–3.0 million years ago, Ma) from models and proxy data. (a) Simulated surface air temperature (left) and precipitation rate anomaly (right) anomaly (relative to 1850–1900) from the Pliocene Model Intercomparison Project Phase 2 multi-model mean, including CMIP6 (n = 4) and non-CMIP6 (n = 12) models. Symbols represent site-level proxy-based estimates of sea-surface temperature for KM5c (n = 32), and terrestrial temperature (n = 8) and precipitation rate for the MPWP (n = 8). (b) Distribution of terrestrial biomes was considerably different during the Piacenzian Stage (3.6–2.6 Ma) (upper) compared with present-day (lower). Biome distributions simulated with a model (BIOME4) in which Pliocene biome classifications are based on 208 locations, with model-predicted biomes filling spatial gaps, and the present day, with the model adjusted for CO2 concentration of 324 parts per million (ppm). (c) Ice-sheet extent predicted using modelled climate forcing and showing where multiple models consistently predict the former presence or absence of ice on Greenland (n = 8 total) and Antarctica (n = 10 total). Further details on data sources and processing are available in the chapter data table (Table 2.SM.1).