Back chapter figures
Figure 2.10
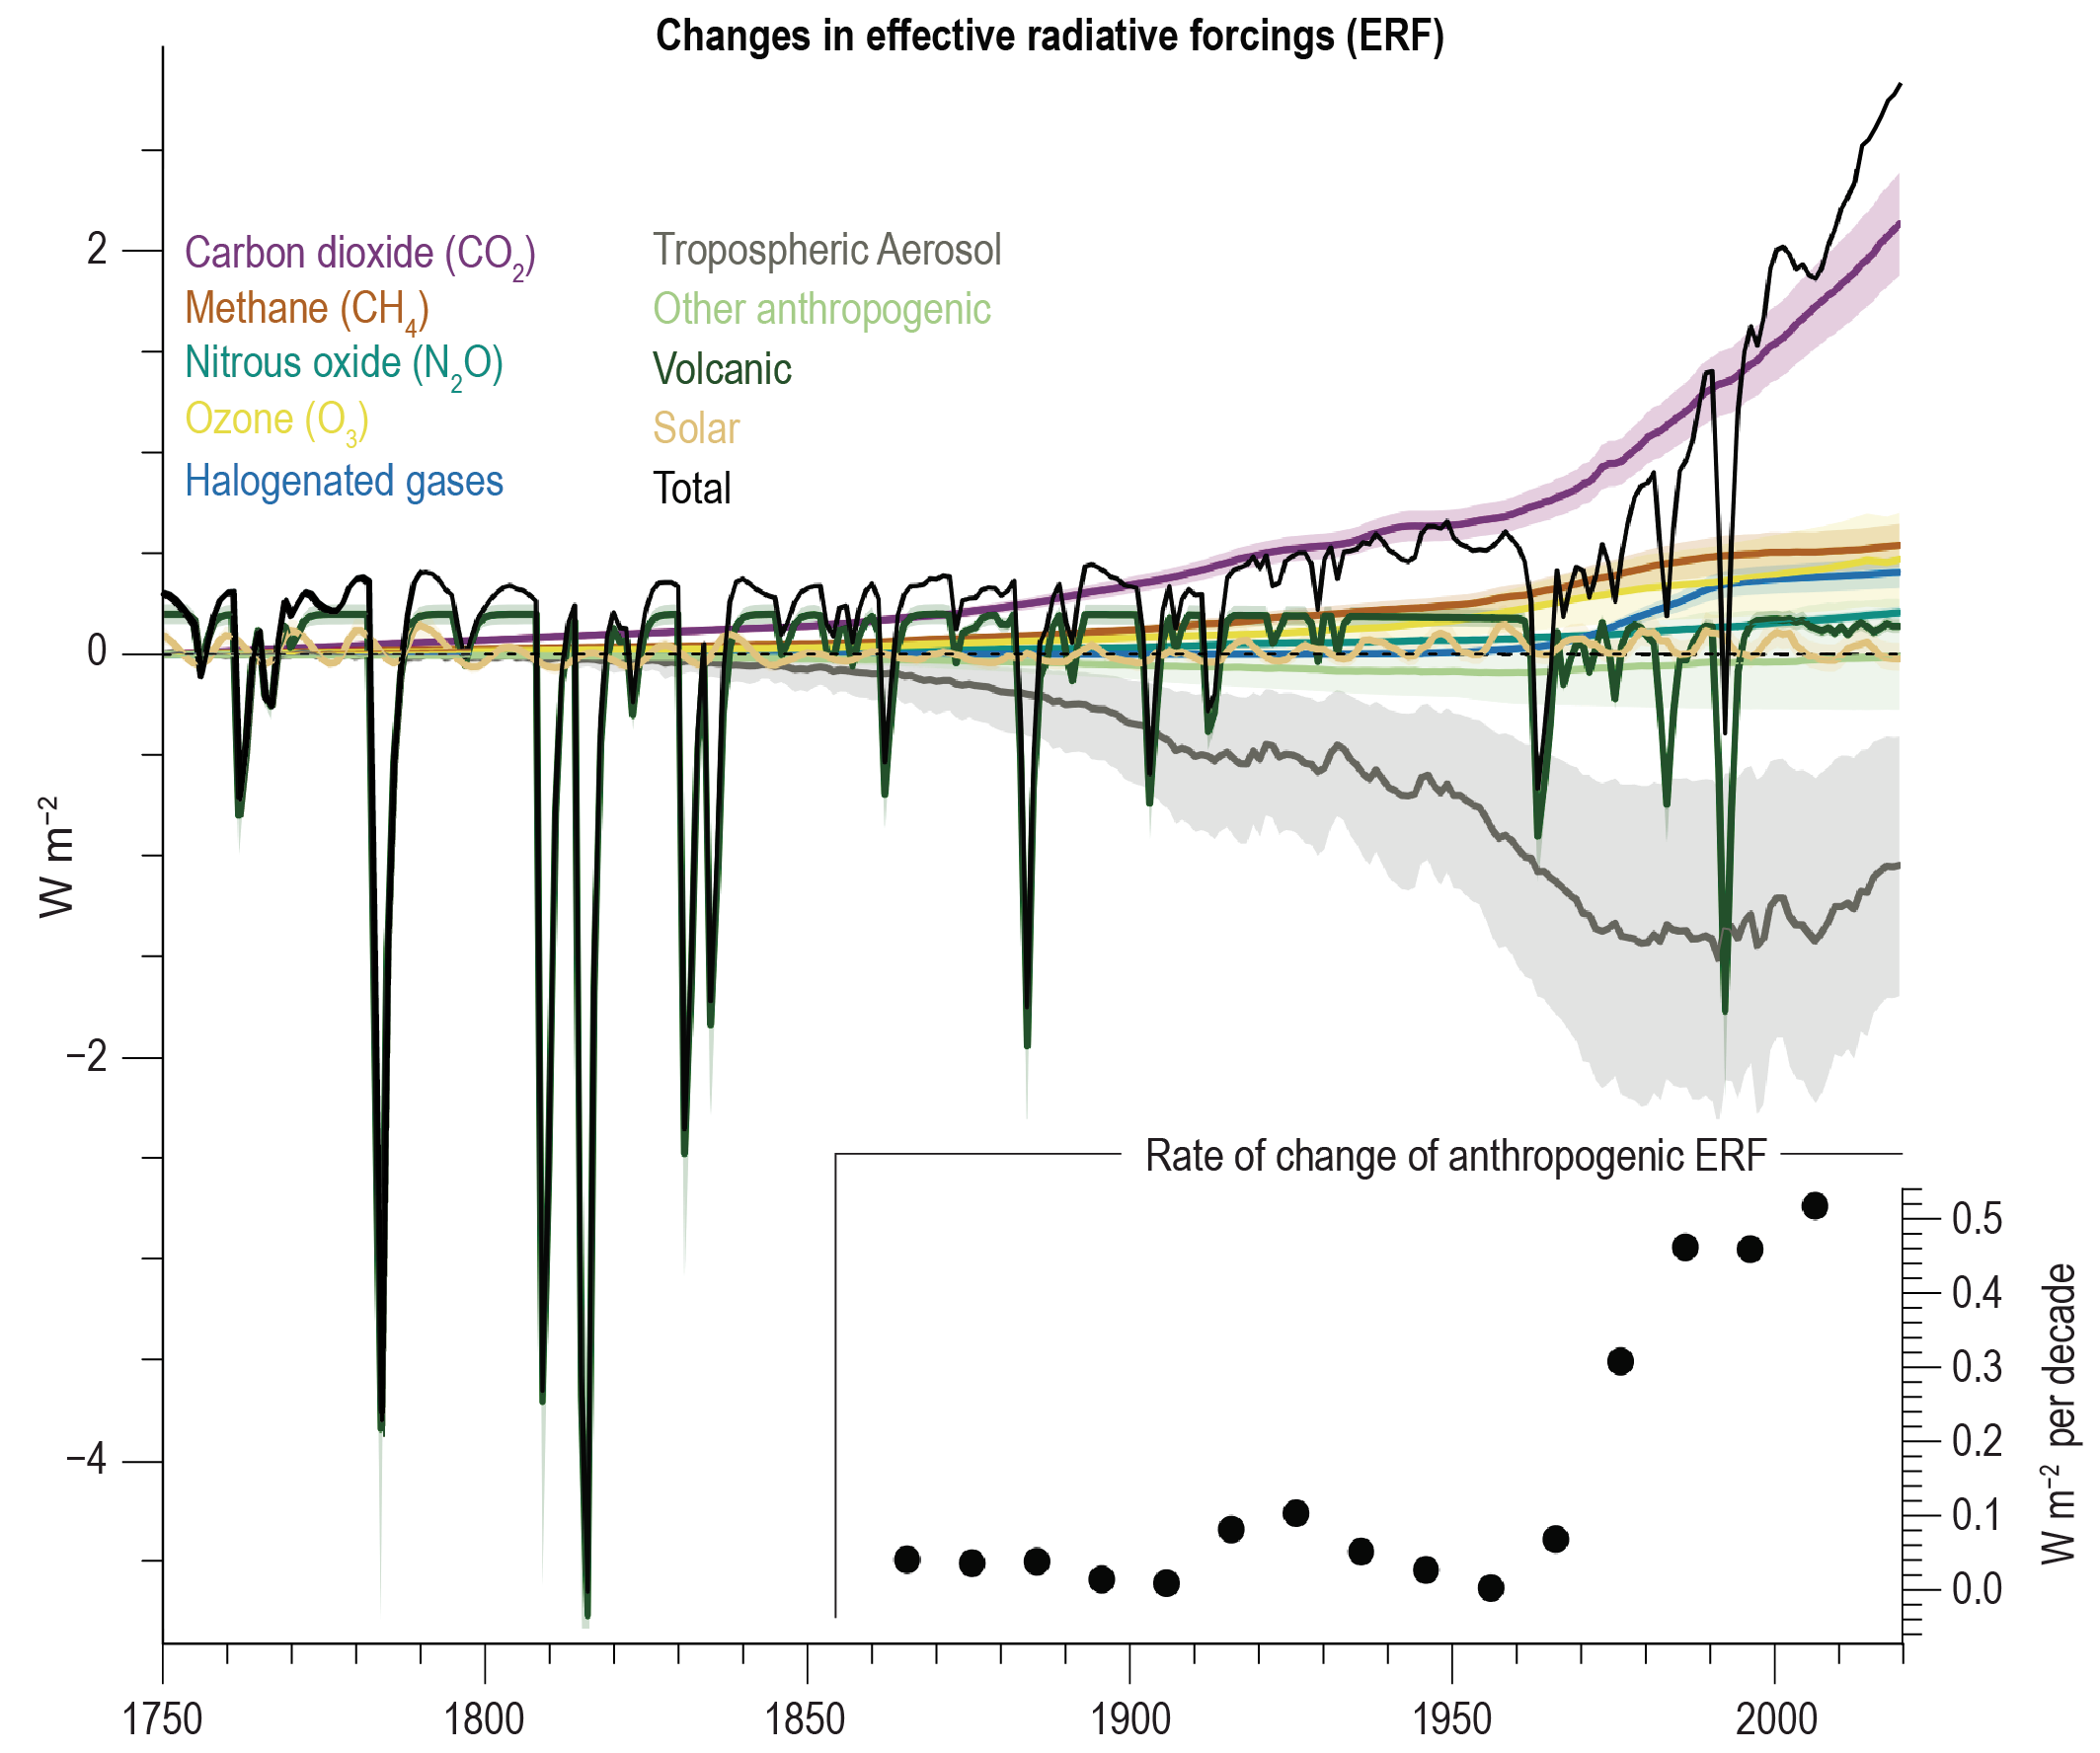
Figure caption
Figure 2.10 | Temporal evolution of effective radiative forcing (ERF) related to the drivers assessed in Section 2.2. ERFs are based upon the calculations described in Chapter 7, of which the global annual mean, central assessment values are shown as lines and the 5 to 95% uncertainty range as shading (Section 7.3, see Figures 7.6 to 7.8 for more detail on uncertainties). The inset plot shows the rate of change (linear trend) in total anthropogenic ERF (total without TSI and volcanic ERF) for 30-year periods centred at each dot. Further details on data sources and processing are available in the chapter data table (Table 2.SM.1).