Back chapter figures
Figure 2.11
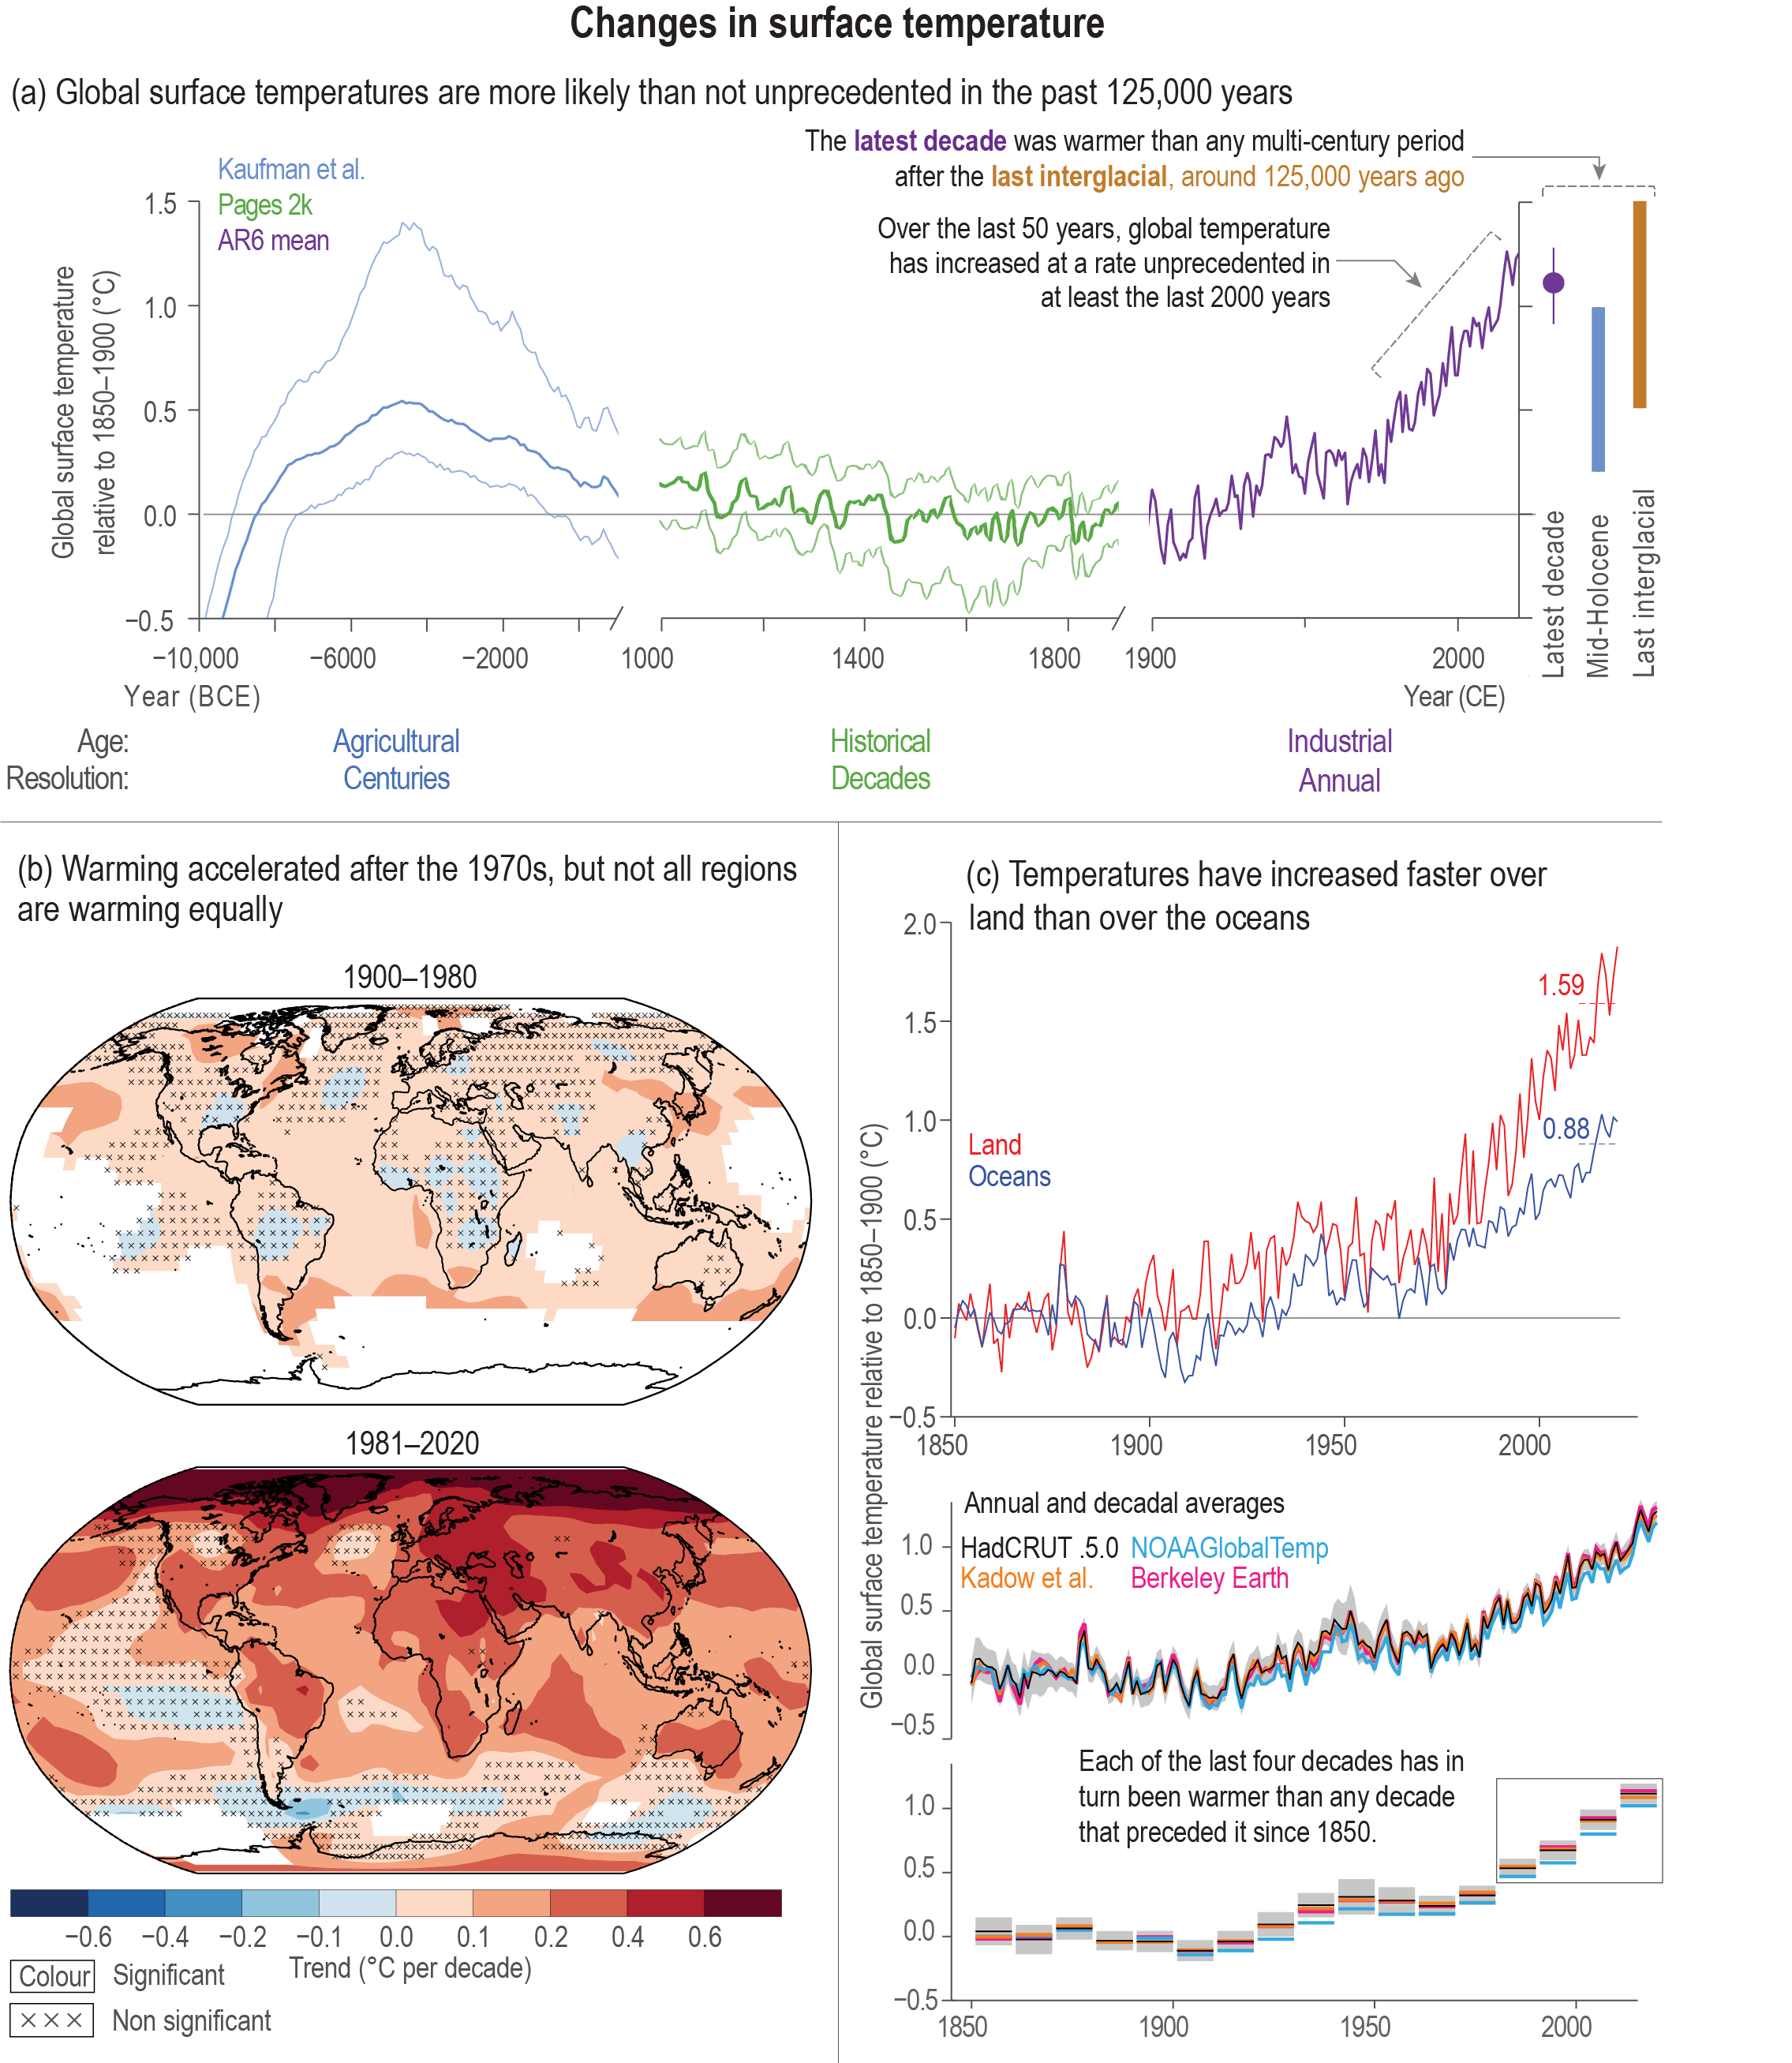
Figure caption
Figure 2.11 | Earth’s surface temperature history with key findings annotated within each panel. (a) GMST over the Holocene divided into three time scales: (i) 12 kyr–1 kyr in 100-year time steps; (ii) 1000–1900 CE, 10-year smooth; and (iii) 1900–2020 CE (from panel (c)). Median of the multi-method reconstruction (bold lines), with 5th and 95th percentiles of the ensemble members (thin lines). Vertical bars are the assessed medium confidence ranges of GMST for the Last Interglacial and mid-Holocene Section 2.3.1.1). The last decade value and very likely range arises from Section 2.3.1.1.3. (b) Spatially resolved trends (°C per decade) for HadCRUTv5 over (upper map) 1900–1980, and (lower map) 1981–2020. Significance is assessed following AR(1) adjustment after Santer et al. (2008), ‘×’ marks denote non-significant trends. (c) Temperature from instrumental data for 1850–2020, including (upper panel) multi-product mean annual time series assessed in Section 2.3.1.1.3 for temperature over the oceans (blue line) and temperature over the land (red line) and indicating the warming to the most recent 10 years; and annually (middle panel) and decadally (bottom panel) resolved averages for the GMST datasets assessed in Section 2.3.1.1.3. The grey shading in each panel shows the uncertainty associated with the HadCRUT5 estimate (Morice et al., 2021). All temperatures relative to the 1850–1900 reference period. Further details on data sources and processing are available in the chapter data table (Table 2.SM.1).