Back chapter figures
Figure 2.12
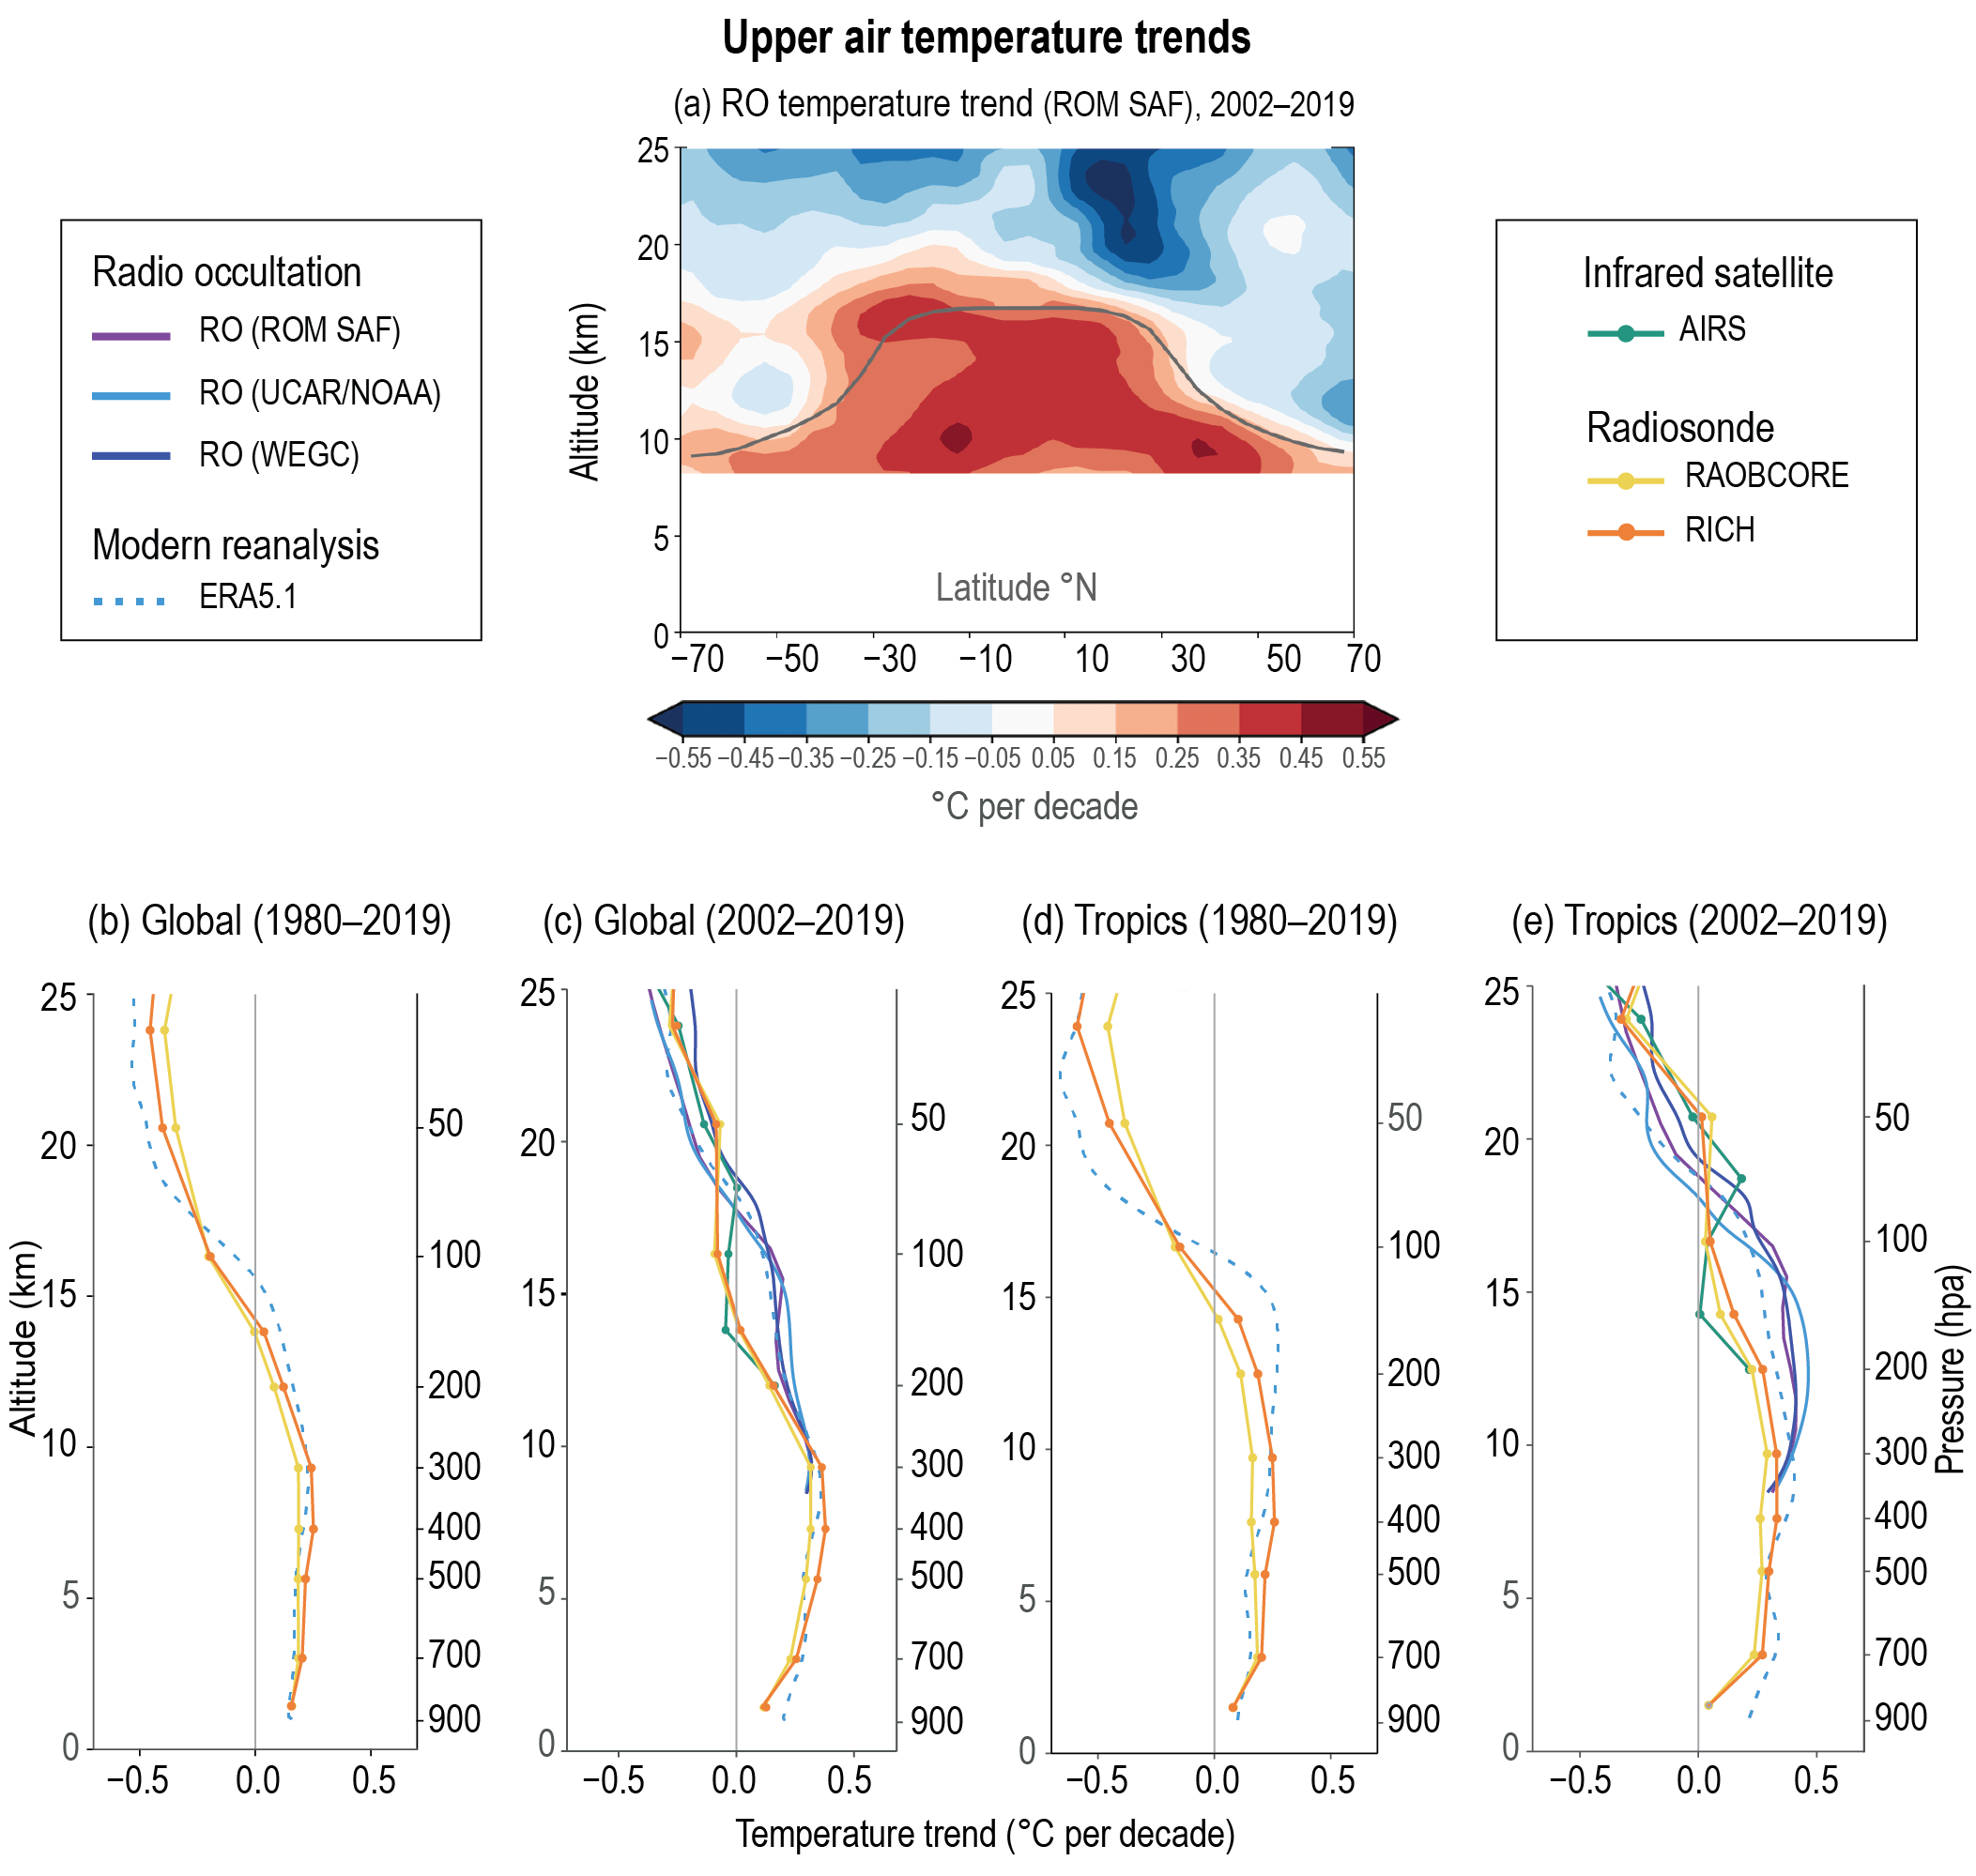
Figure caption
Figure 2.12 | Temperature trends in the upper air. (a) Zonal cross-section of temperature anomaly trends (2007–2016 baseline) for 2002–2019 in the upper troposphere and lower stratosphere region. The climatological tropopause altitude is marked by a grey line. Significance is not indicated due to the short period over which trends are shown, and because the assessment findings associated to this figure relate to difference between trends at different heights, not the absolute trends. (b, c) Trends in temperature at various atmospheric heights for 1980–2019 and 2002–2019 for the near-global (70°N–70°S) domain. (d, e) as for (b, c) but for the tropical (20°N–20°S) region. Further details on data sources and processing are available in the chapter data table (Table 2.SM.1).