Back chapter figures
Figure 2.13
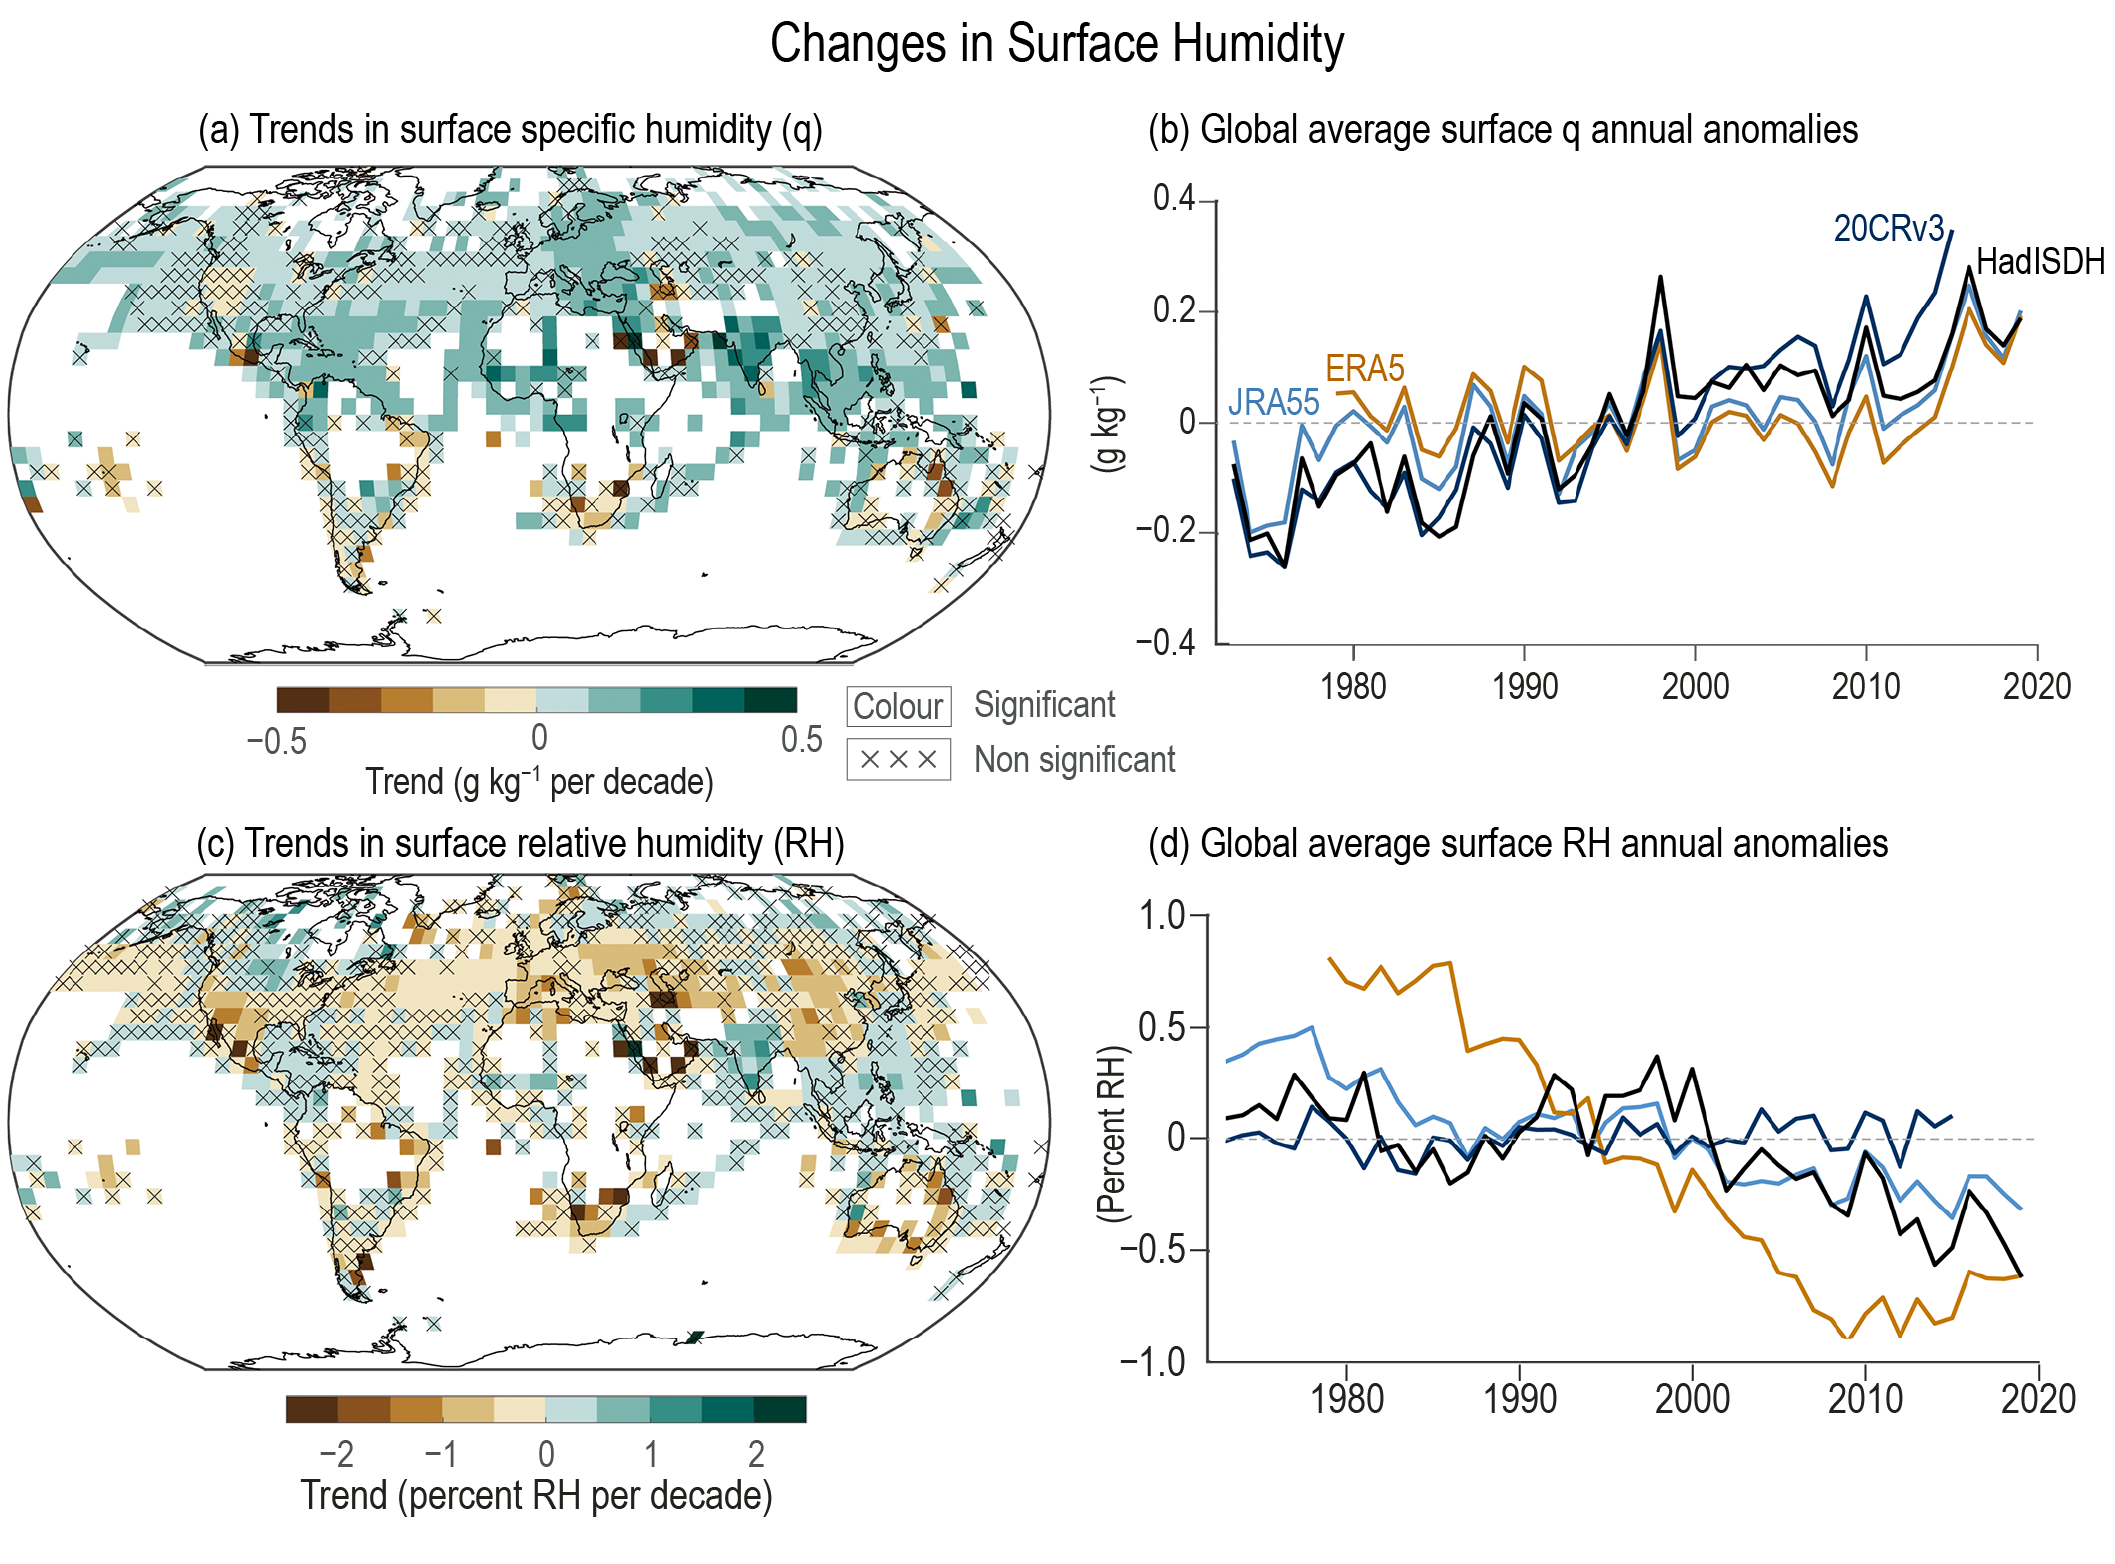
Figure caption
Figure 2.13 | Changes in surface humidity. (a) Trends in surface specific humidity over 1973–2019. Trends are calculated using OLS regression with significance assessed following AR(1) adjustment after Santer et al. (2008); ‘×’ marks denote non-significant trends). (b) Global average surface specific humidity annual anomalies (1981–2010 base period). (c) as (a) but for the relative humidity. (d) as (b) but for the global average surface relative humidity annual anomalies. Further details on data sources and processing are available in the chapter data table (Table 2.SM.1).