Back chapter figures
Figure 2.15
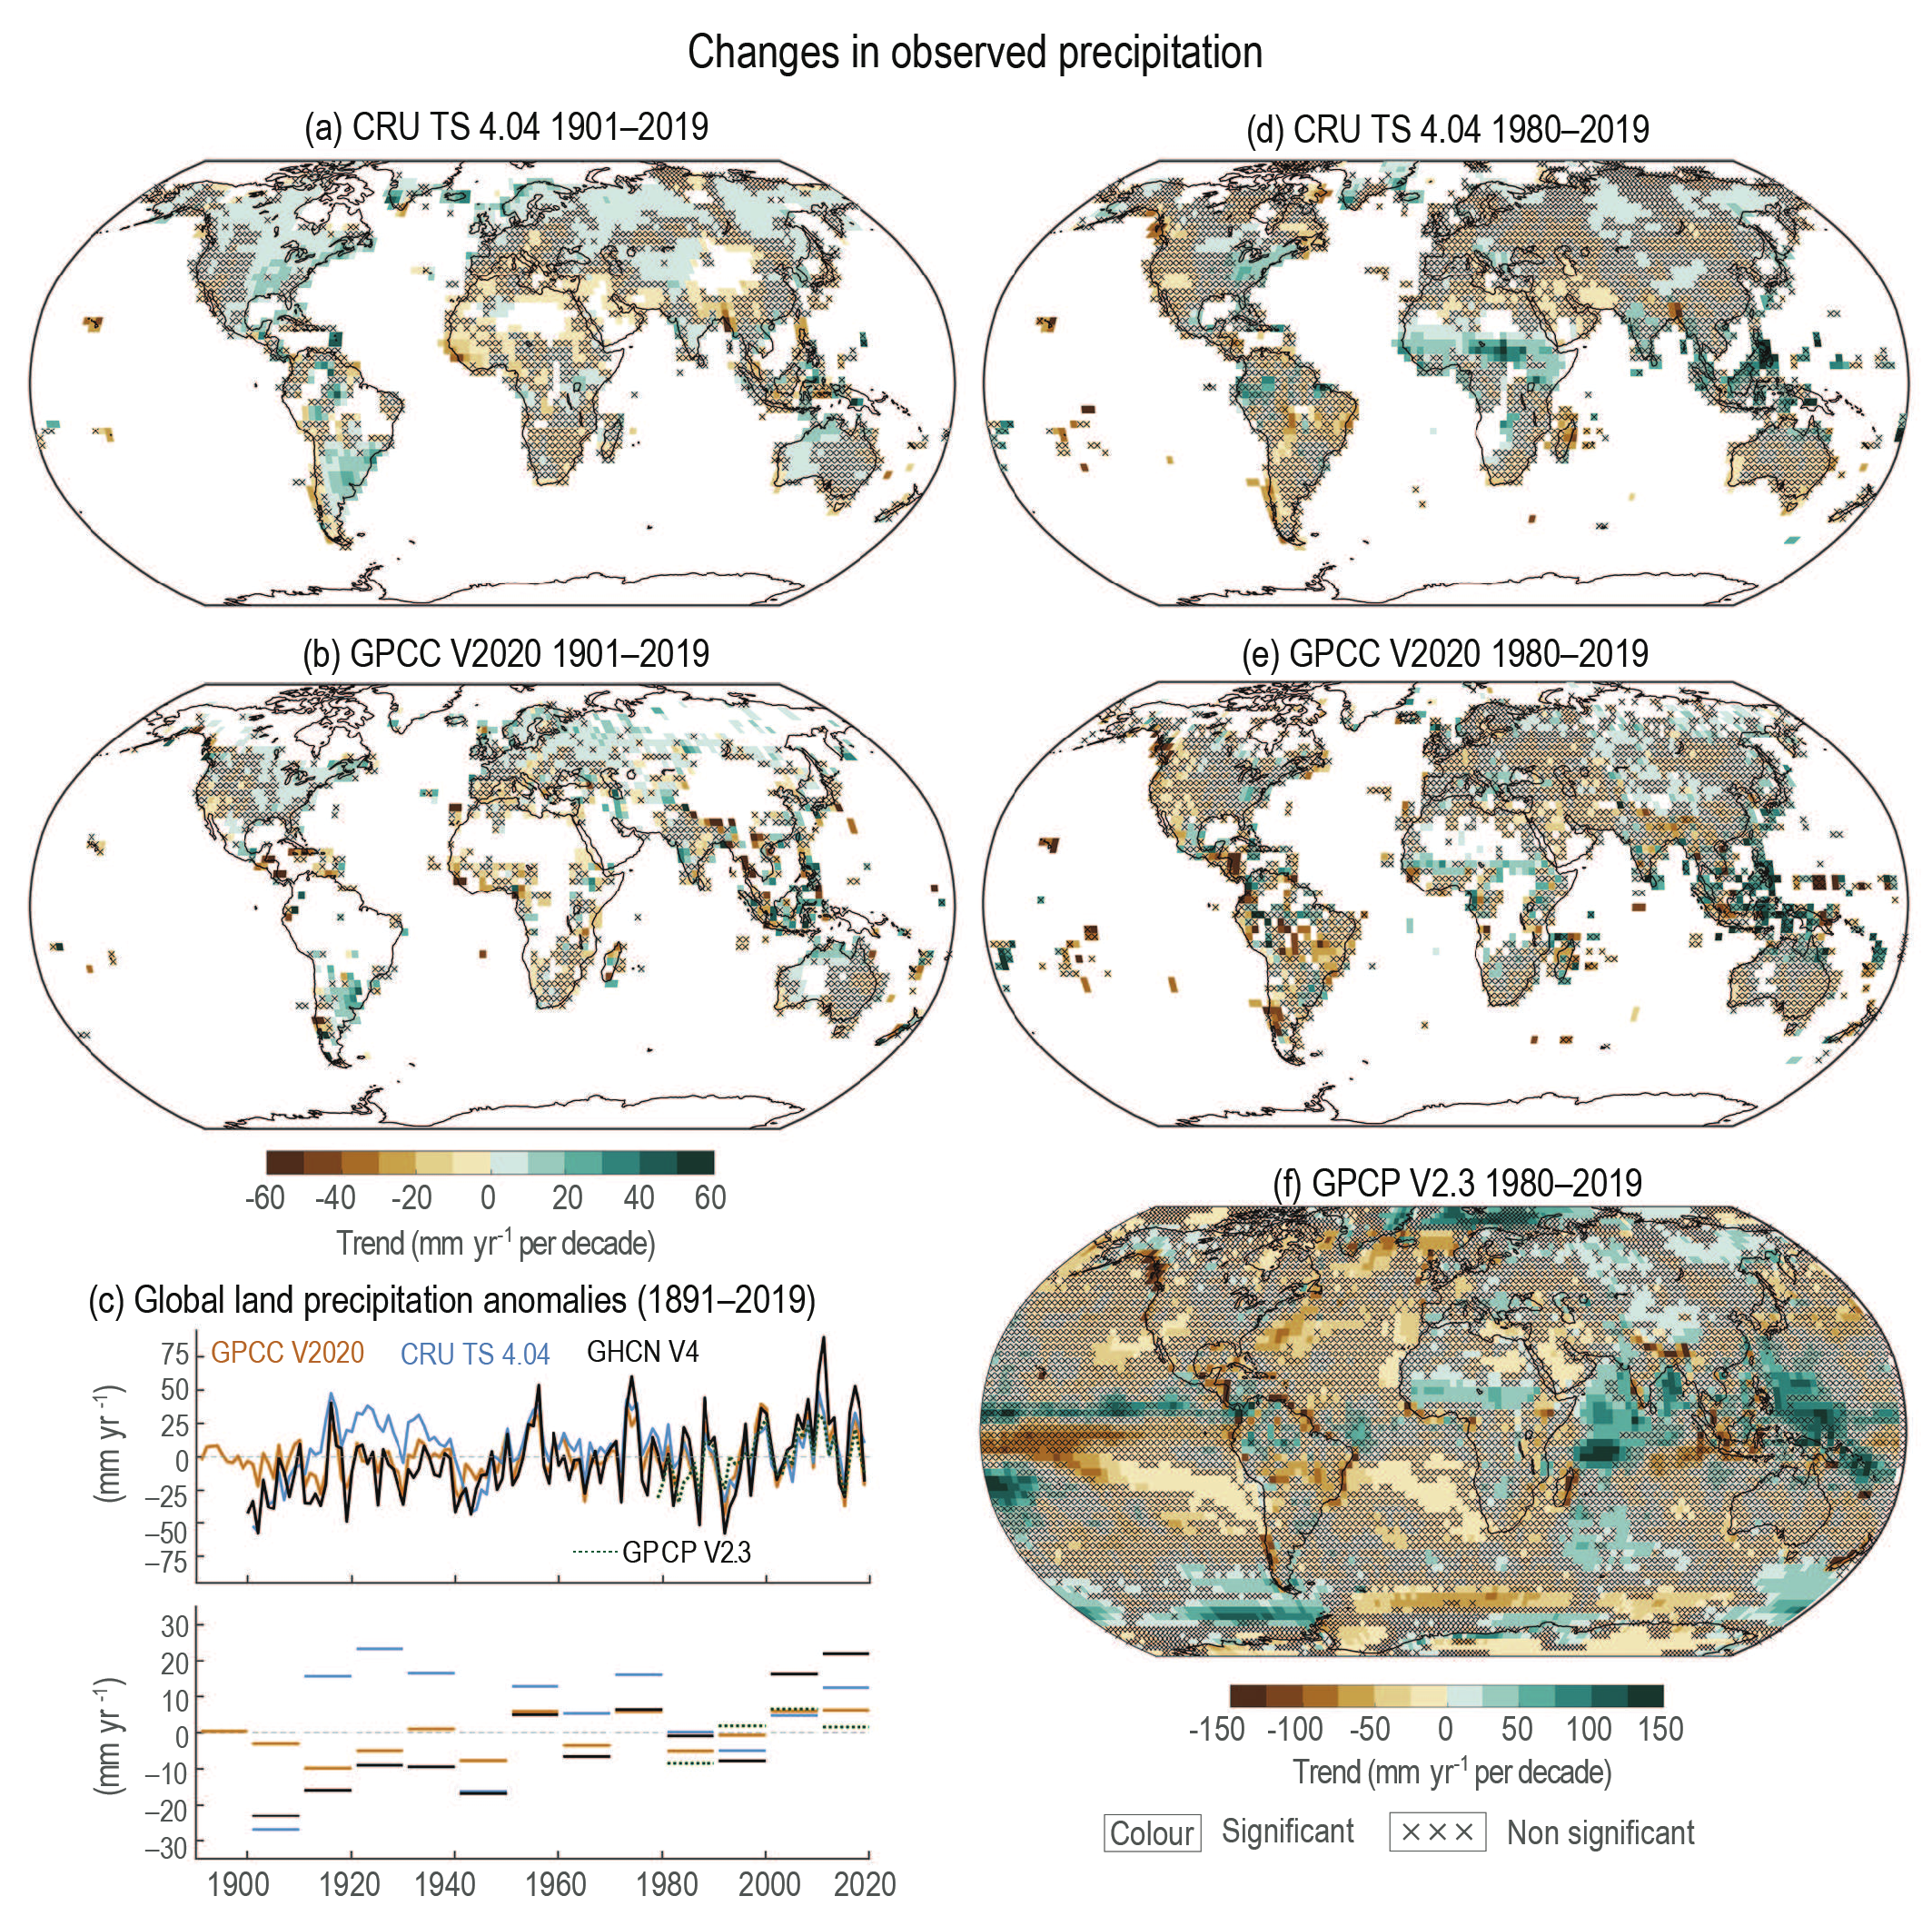
Figure caption
Figure 2.15 | Changes in observed precipitation. (a, b) Spatial variability of observed precipitation trends over land for 1901–2019 for two global in-situ products. Trends are calculated using OLS regression with significance assessed following AR(1) adjustment after Santer et al. (2008) (‘×’ marks denote non-significant trends). (c) Annual time series and decadal means from 1891 to date relative to a 1981–2010 climatology (note that different products commence at distinct times). (d, e) as(a, b), but for the periods starting in 1980. (f) is for the same period for the globally complete merged GPCP v2.3 product. Further details on data sources and processing are available in the chapter data table (Table 2.SM.1).