Back chapter figures
Figure 2.16
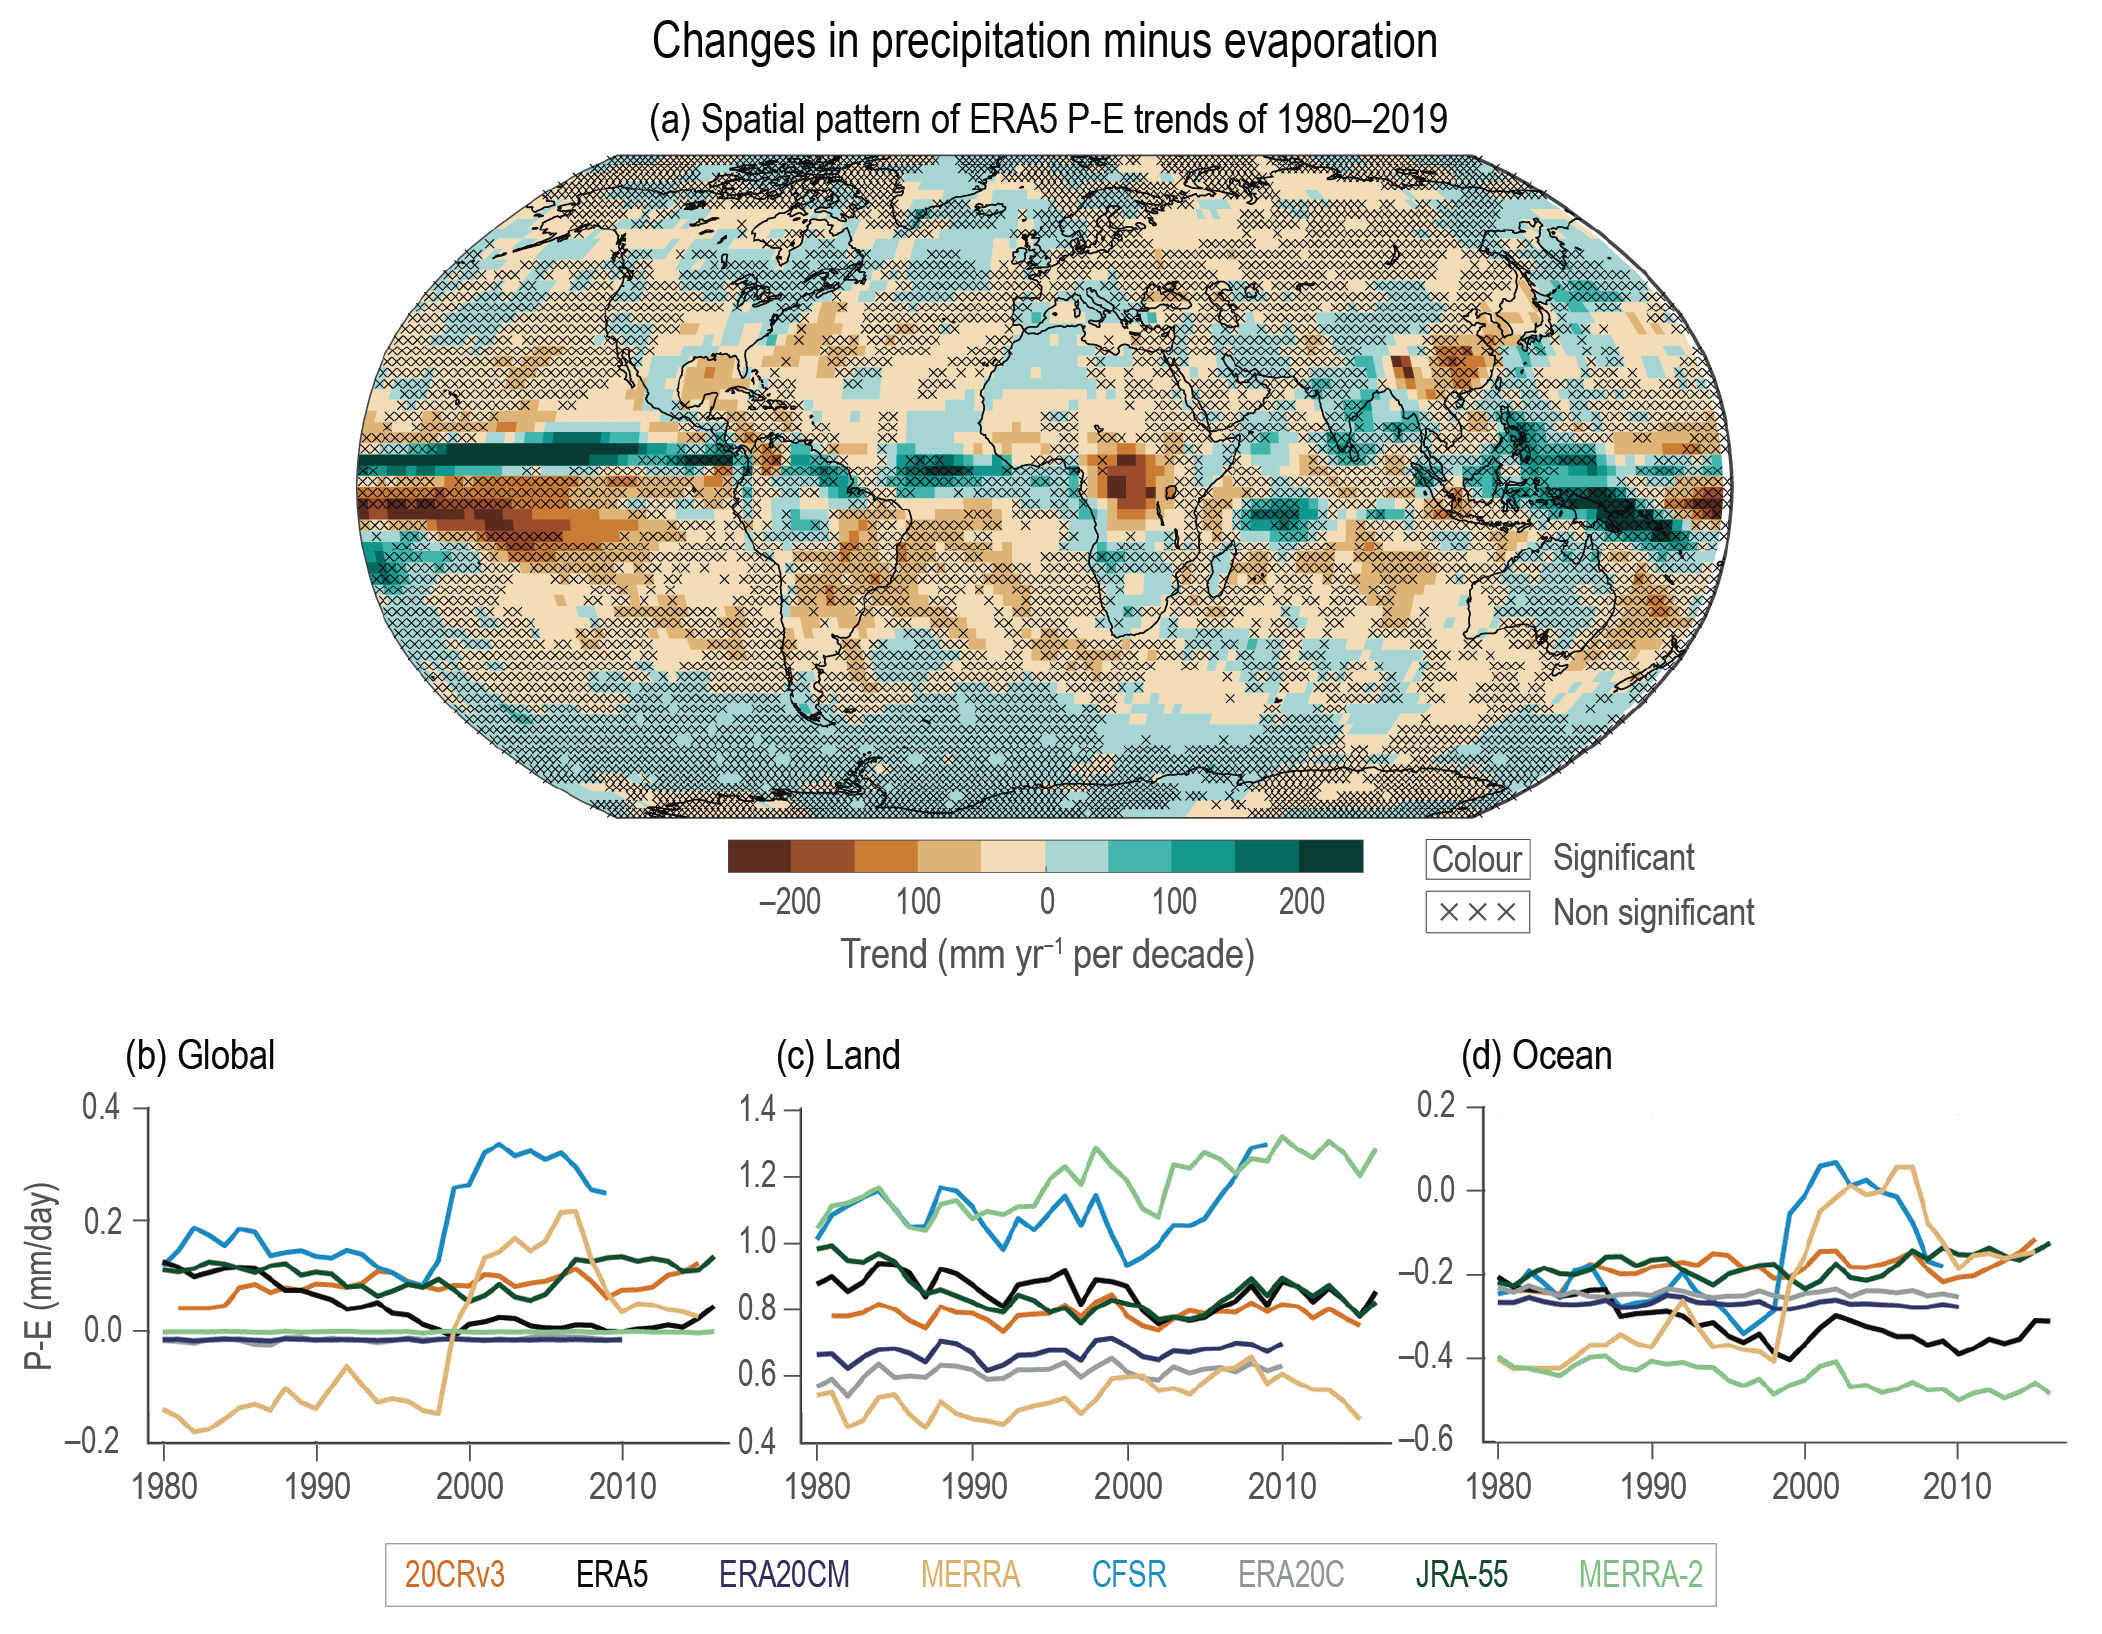
Figure caption
Figure 2. 16 | Changes in precipitation minus evaporation. (a) Trends in precipitation minus evaporation (P–E) between 1980 and 2019. Trends are calculated using OLS regression with significance assessed following AR(1) adjustment after Santer et al. (2008) (‘×’ marks denote non-significant trends). Time series of (b) global, (c) land-only and (d) ocean-only average annual P–E (mm day–1). Further details on data sources and processing are available in the chapter data table (Table 2.SM.1).