Back chapter figures
Figure 2.17
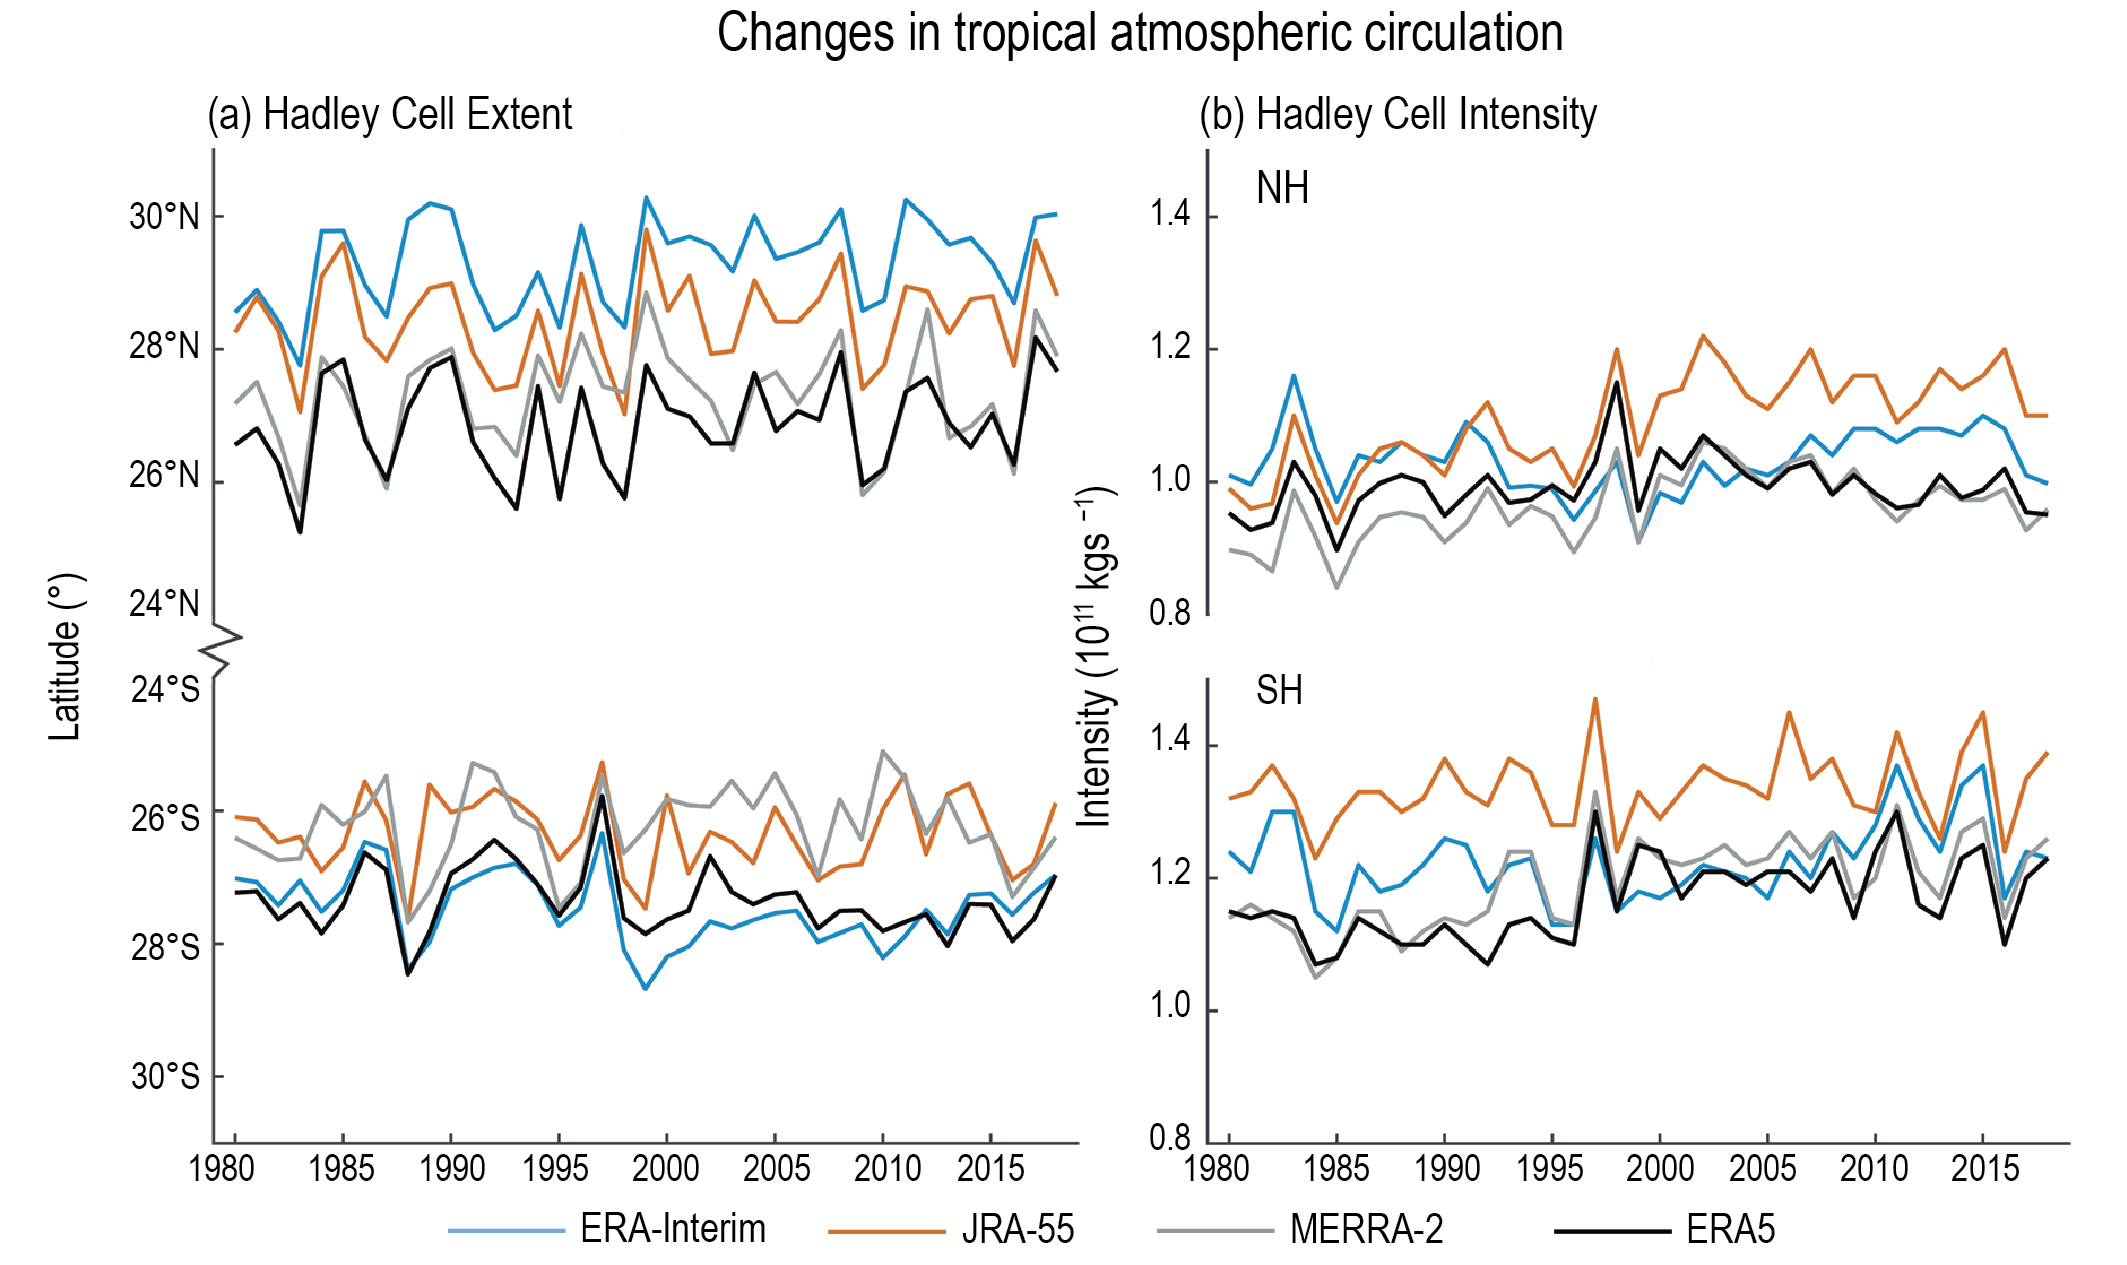
Figure caption
Figure 2.17 | Time series of the annual mean Northern Hemisphere (NH, top curves) and Southern Hemisphere (SH, bottom curves) Hadley cell extent (a) and Hadley cell intensity (b) since 1979. Further details on data sources and processing are available in the chapter data table (Table 2.SM.1).