Back chapter figures
Figure 2.2
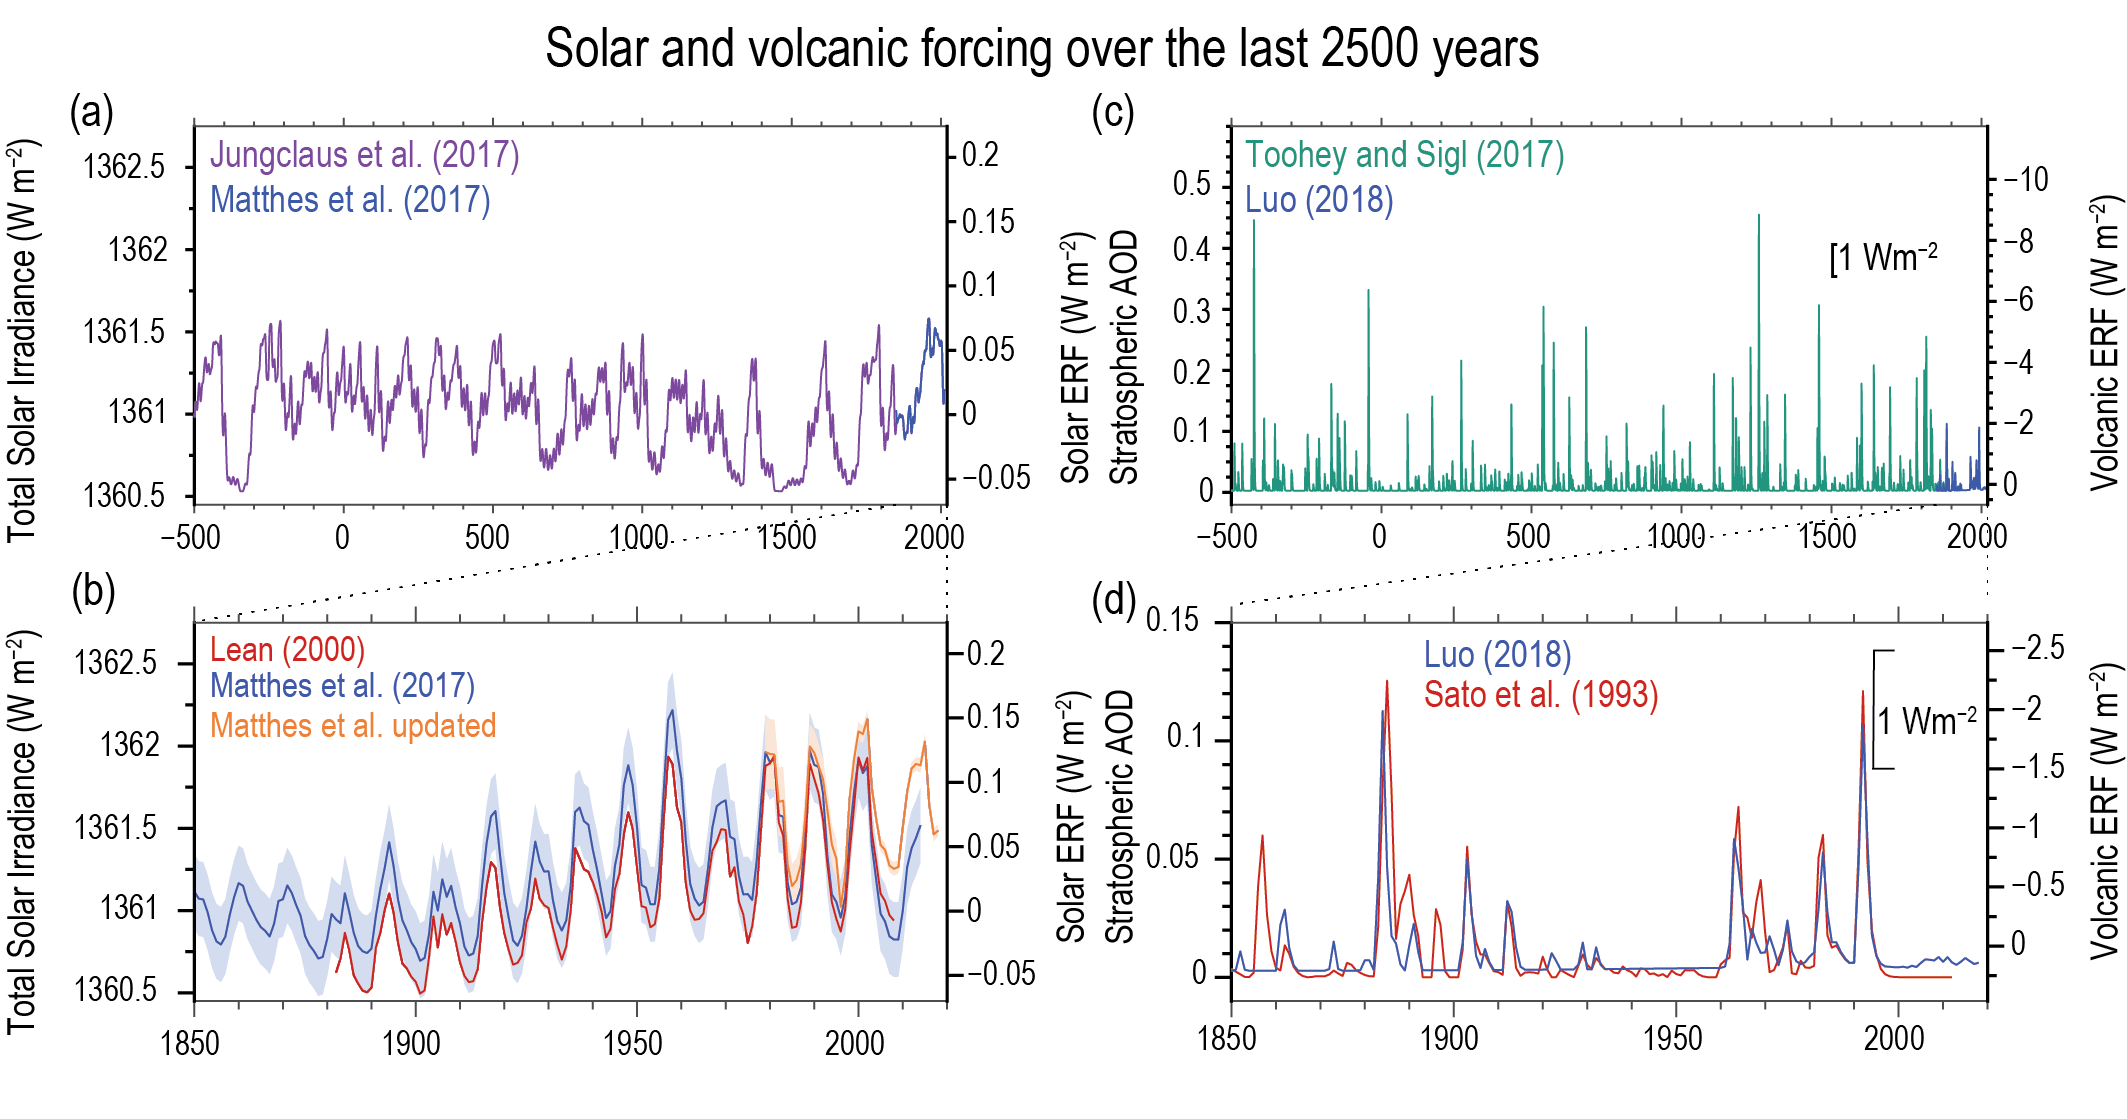
Figure caption
Figure 2.2 | Time series of solar and volcanic forcing for the past 2500 years (a, c) and since 1850 (b, d). (a) Total solar irradiance (TSI) reconstruction (10-year running averages) recommended for CMIP6/PMIP4 millennial experiments based on the radiocarbon dataset before 1850 (blue) scaled to the CMIP6 historical forcing after 1850 (purple). (b) TSI time series (six-month running averages) from CMIP6 historical forcing as inferred from sunspot numbers (blue), compared to CMIP5 forcing based on (red) and an update to CMIP6 by a TSI composite (orange). (c) Volcanic forcing represented as reconstructed stratospheric aerosol optical depth (SAOD; as presented in Section 7.3.4.6) at 550 nm. Estimates covering 500 BCE to 1900 CE (green) and 1850–2015 (blue). (d) SAOD reconstruction from CMIP6 (v 4) (blue), compared to CMIP5 forcing (red). Note the change in y-axis range between panels (c) and (d). Further details on data sources and processing are available in the chapter data table (Table 2.SM.1).