Back chapter figures
Figure 2.20
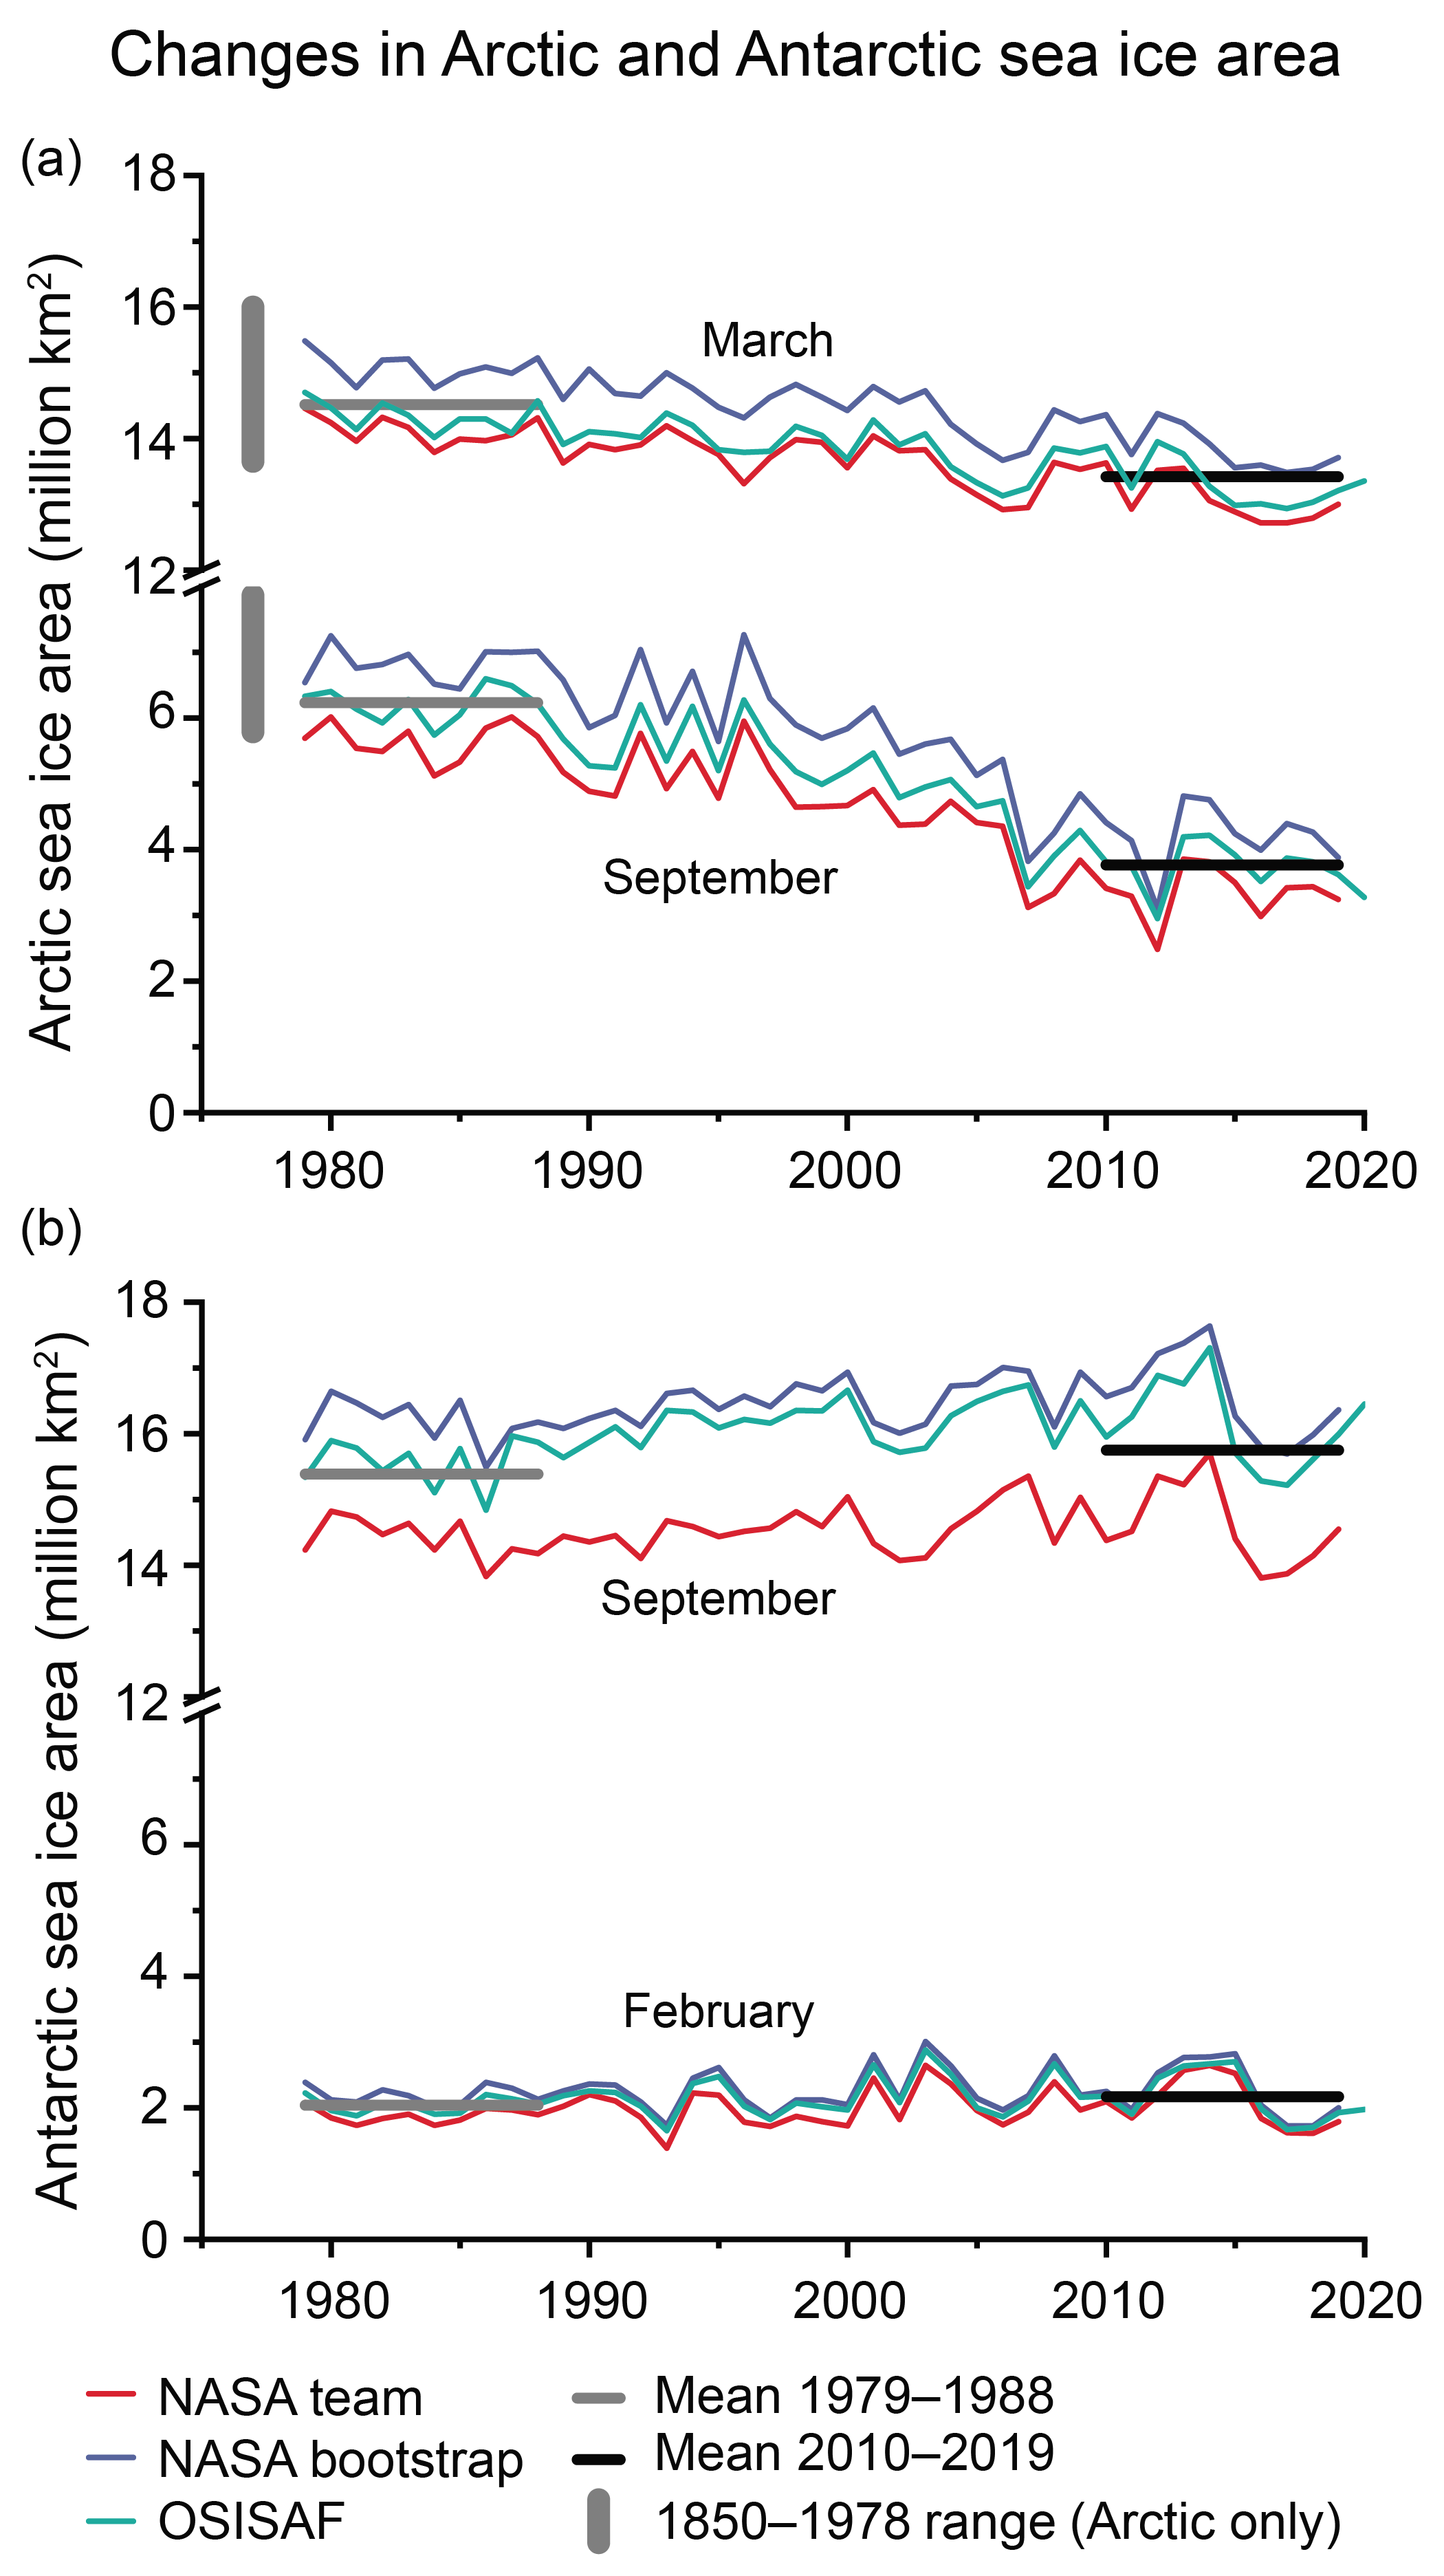
Figure caption
Figure 2.20 | Changes in Arctic and Antarctic sea ice area. (a) Three time series of Arctic sea-ice area (SIA) for March and September from 1979 to 2020 (passive microwave satellite era). In addition, the range of SIA from 1850–1978 is indicated by the vertical bar to the left. (b) Three time series of Antarctic sea ice area for September and February (1979–2020). In both (a) and (b), decadal means for the three series for the first and most recent decades of observations are shown by horizontal lines in grey (1979–1988) and black (2010–2019). SIA values have been calculated from sea ice concentration fields. Available data for 2020 (OSISAF) is shown in both (a) and (b). Further details on data sources and processing are available in the chapter data table (Table 2.SM.1).