Back chapter figures
Figure 2.21
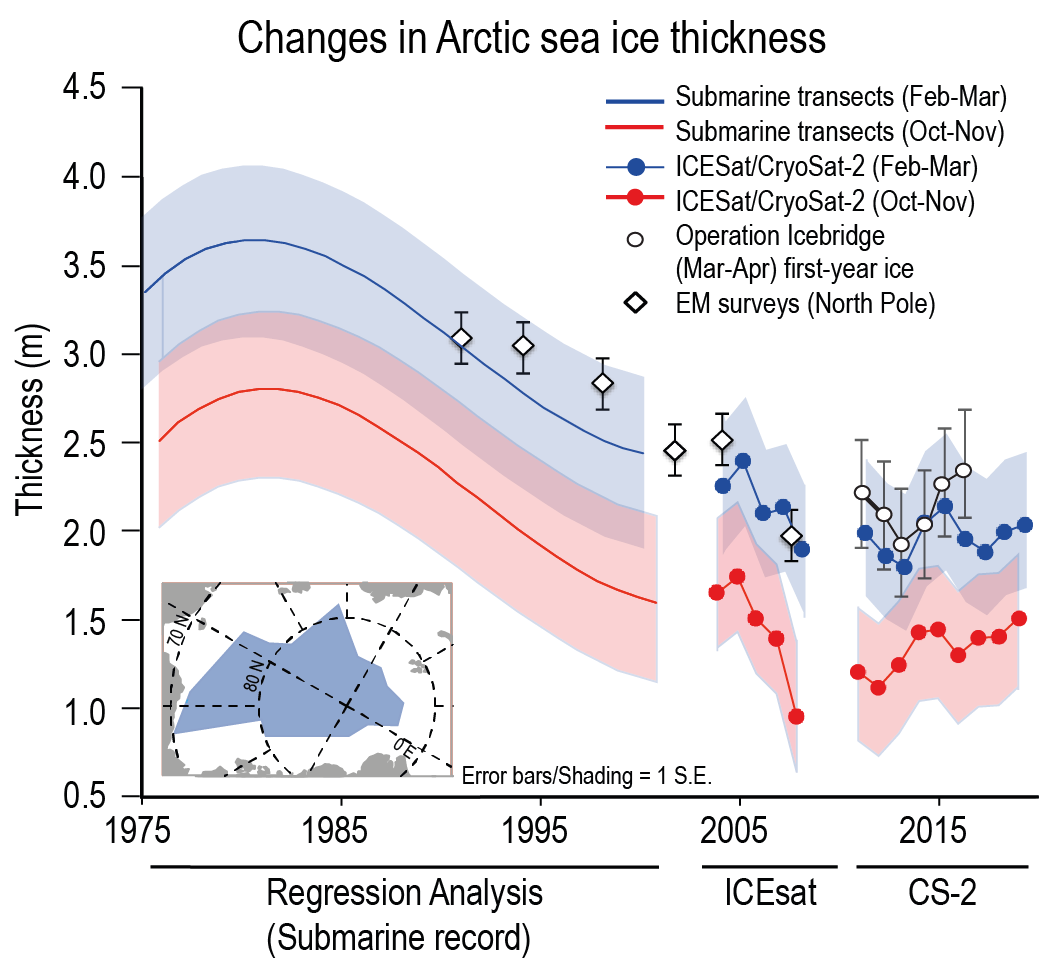
Figure caption
Figure 2.21 | Arctic sea ice thickness changes (means) for autumn (red/dotted red) and winter (blue/dotted blue). Shadings (blue and red) show 1 standard error (S.E.) ranges from the regression analysis of submarine ice thickness and expected uncertainties in satellite ice thickness estimates. Data release area of submarine data ice thickness data is shown in inset. Satellite ice thickness estimates are for the Arctic south of 88°N. Thickness estimates from more localized airborne/ground electromagnetic surveys near the North Pole (diamonds) and from Operation IceBridge (circles) are shown within the context of the larger scale changes in the submarine and satellite records. Further details on data sources and processing are available in the chapter data table (Table 2.SM.1).