Back chapter figures
Figure 2.26
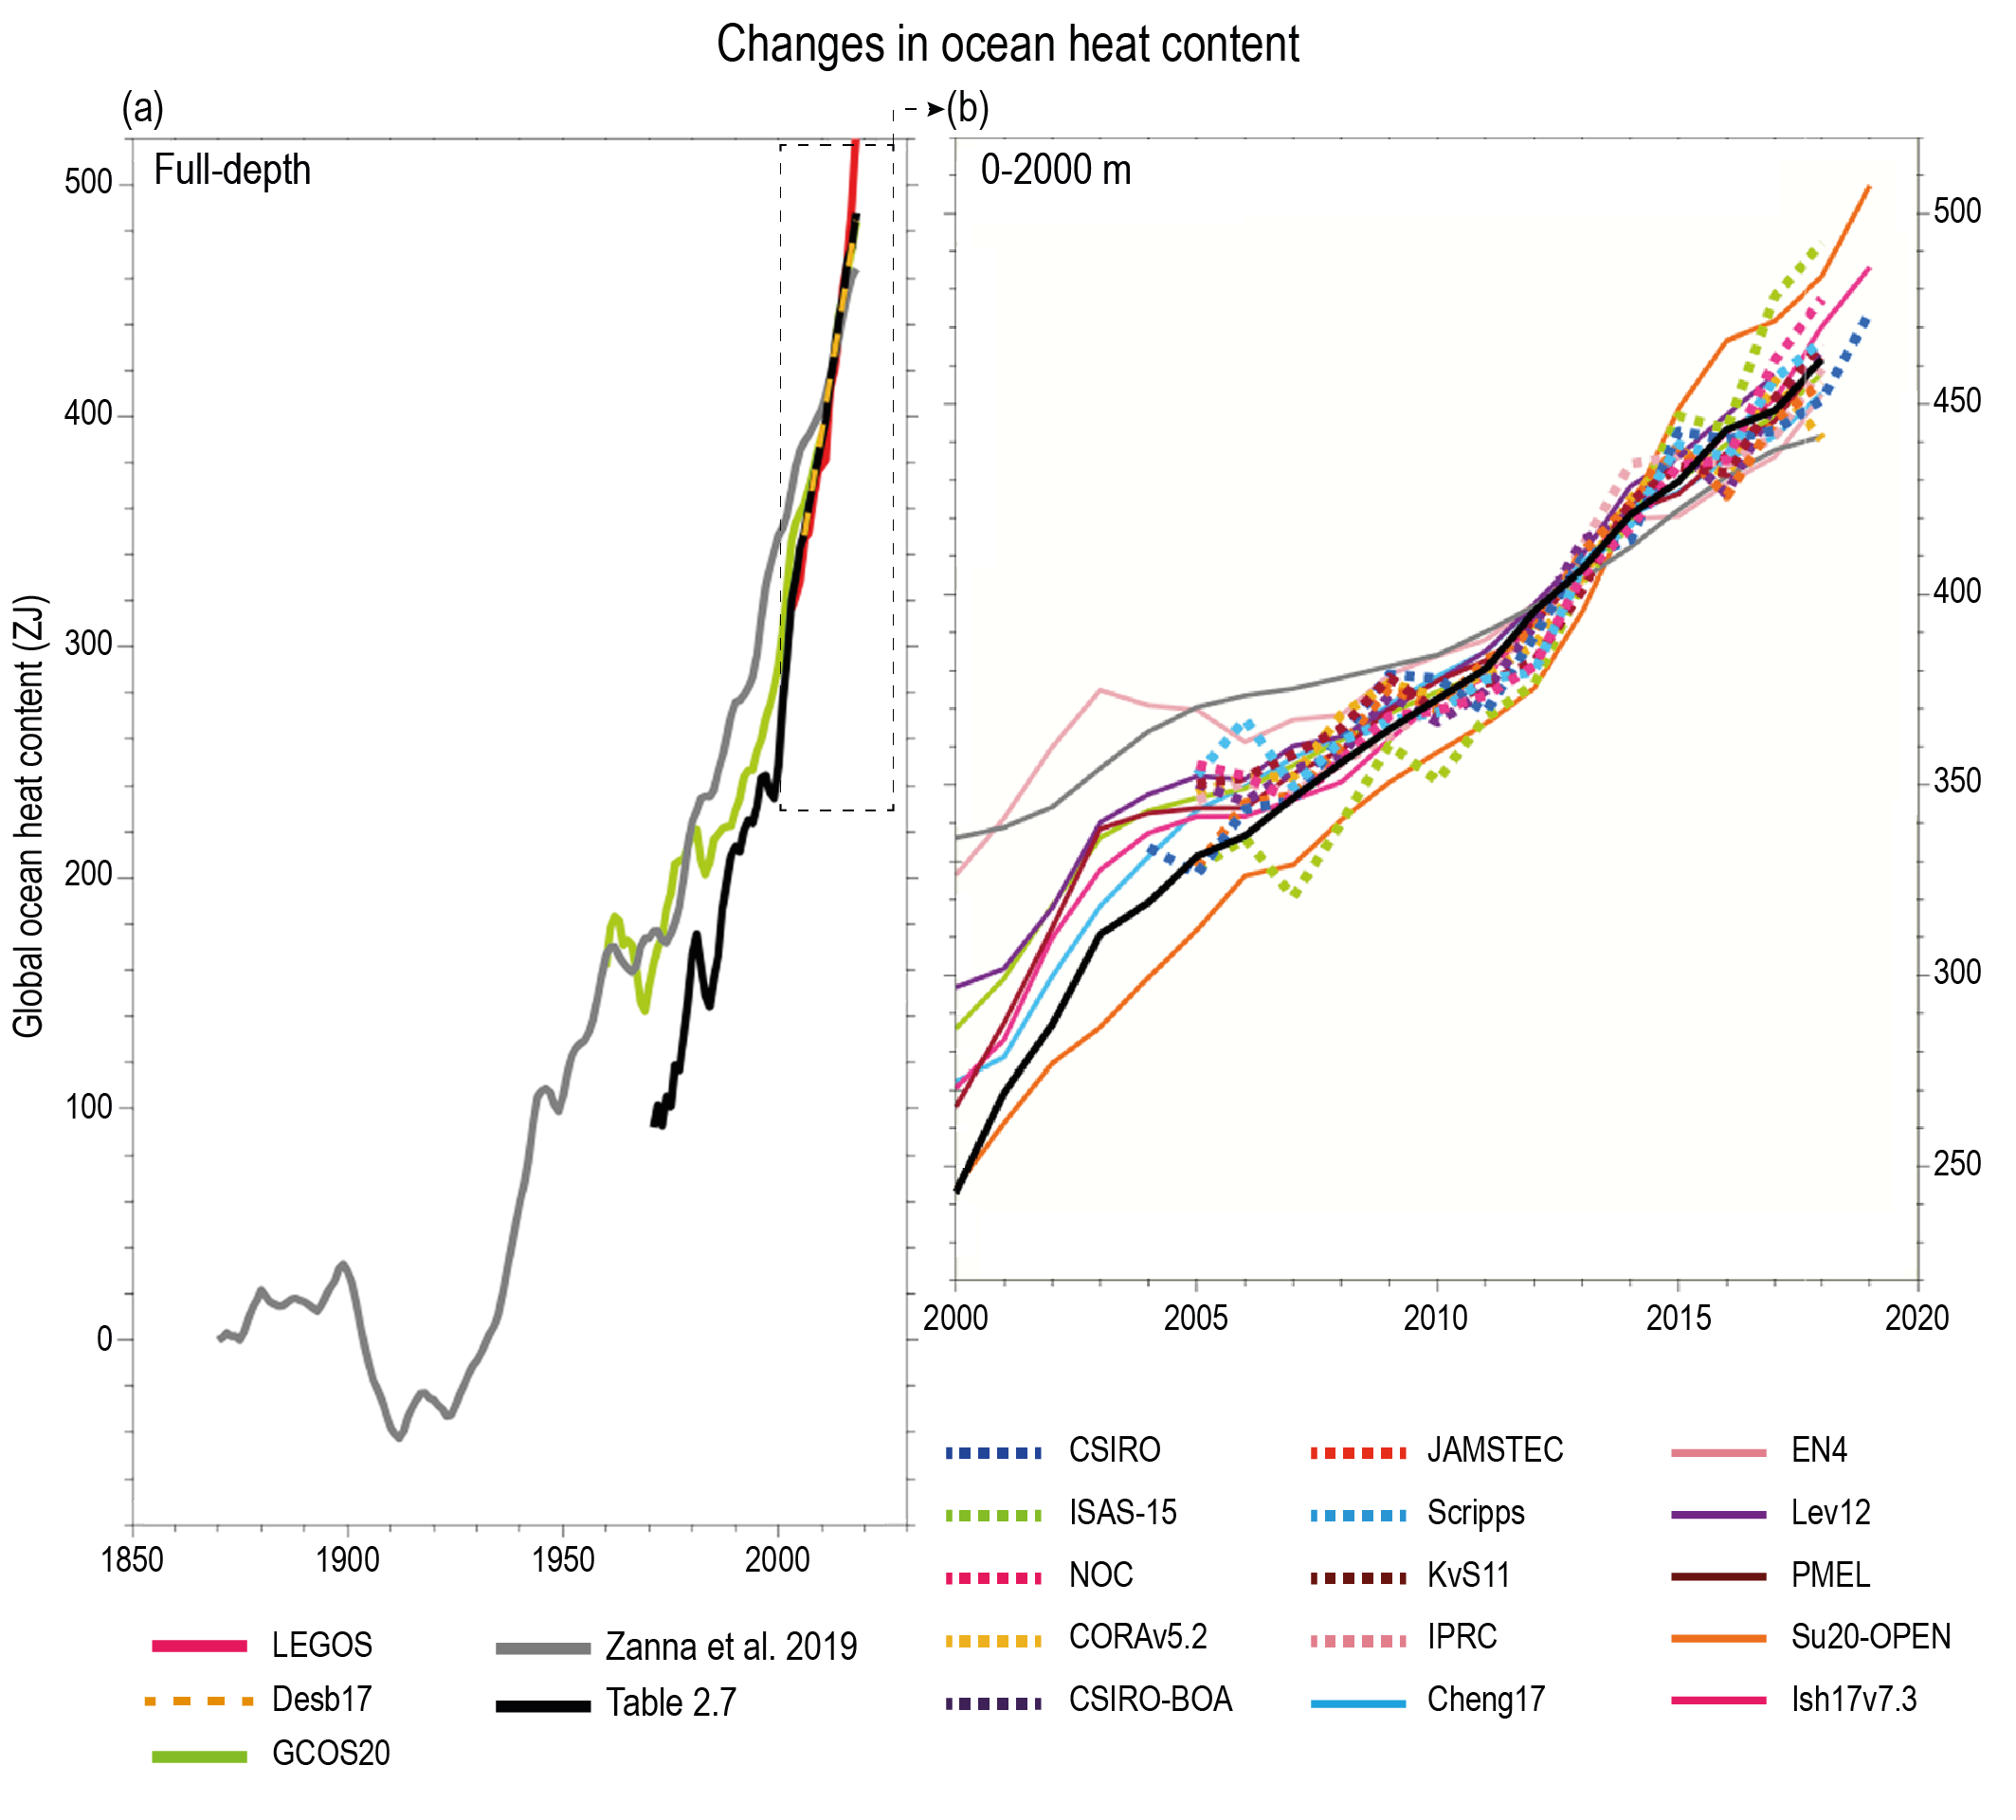
Figure caption
Figure 2.26 | Changes in ocean heat content (OHC). Changes are shown over (a) full depth of the ocean from 1871–2019 from a selection of indirect and direct measurement methods. The series from Table 2.7 is shown in solid black in both (a) and (b) (see Table 2.7 caption for details). (b) as (a) but for 0–2000 m depths only and reflecting the broad range of available estimates over this period. For further details see chapter data table (Table 2.SM.1).