Back chapter figures
Figure 2.3
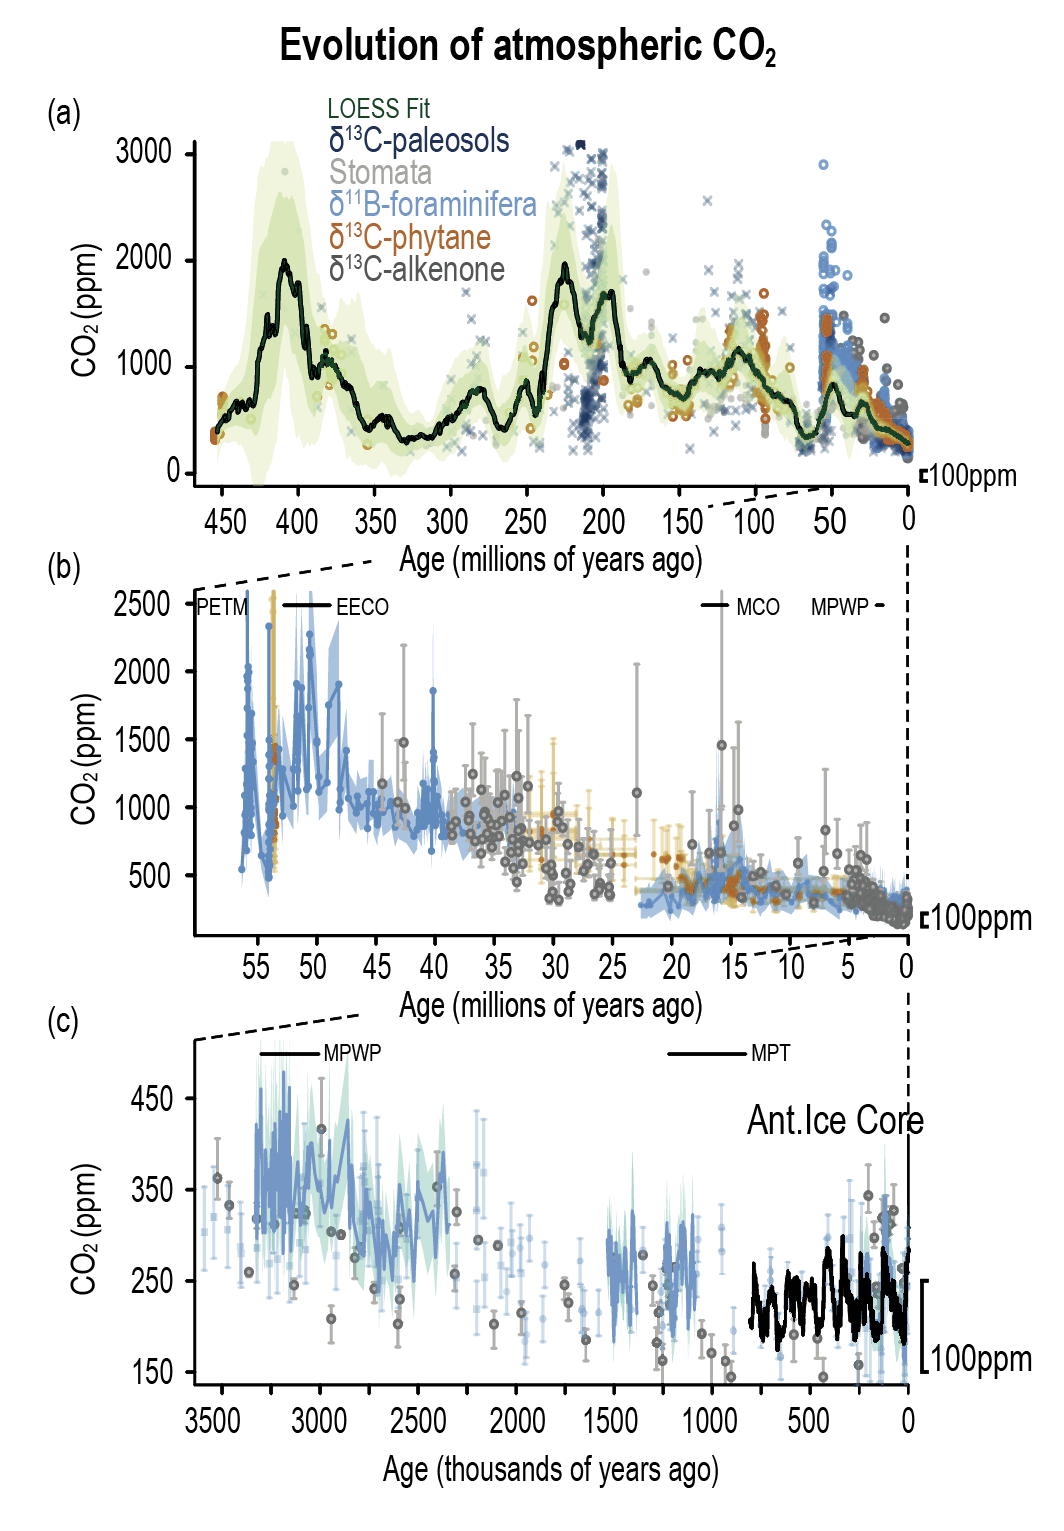
Figure caption
Figure 2.3 | The evolution of atmospheric CO2through the last 450 million years (450 Myr). The periods covered are 0–450 Ma (a), 0–58 Ma (b), and 0–3500 ka (c), reconstructed from continental rock, marine sediment and ice core records. Note different time scales and axes ranges in panels (a), (b) and (c). Dark and light green bands in (a) are uncertainty envelopes at 68% and 95% uncertainty, respectively. 100 ppm in each panel is shown by the marker in the lower right-hand corner to aid comparison between panels. In panel (b) and (c) the major paleoclimate reference periods (CCB2.1) have been labelled, and in addition: MPT (Mid Pleistocene Transition), MCO (Miocene Climatic Optimum). Further details on data sources and processing are available in the chapter data table (Table 2.SM.1).