Back chapter figures
Figure 2.30
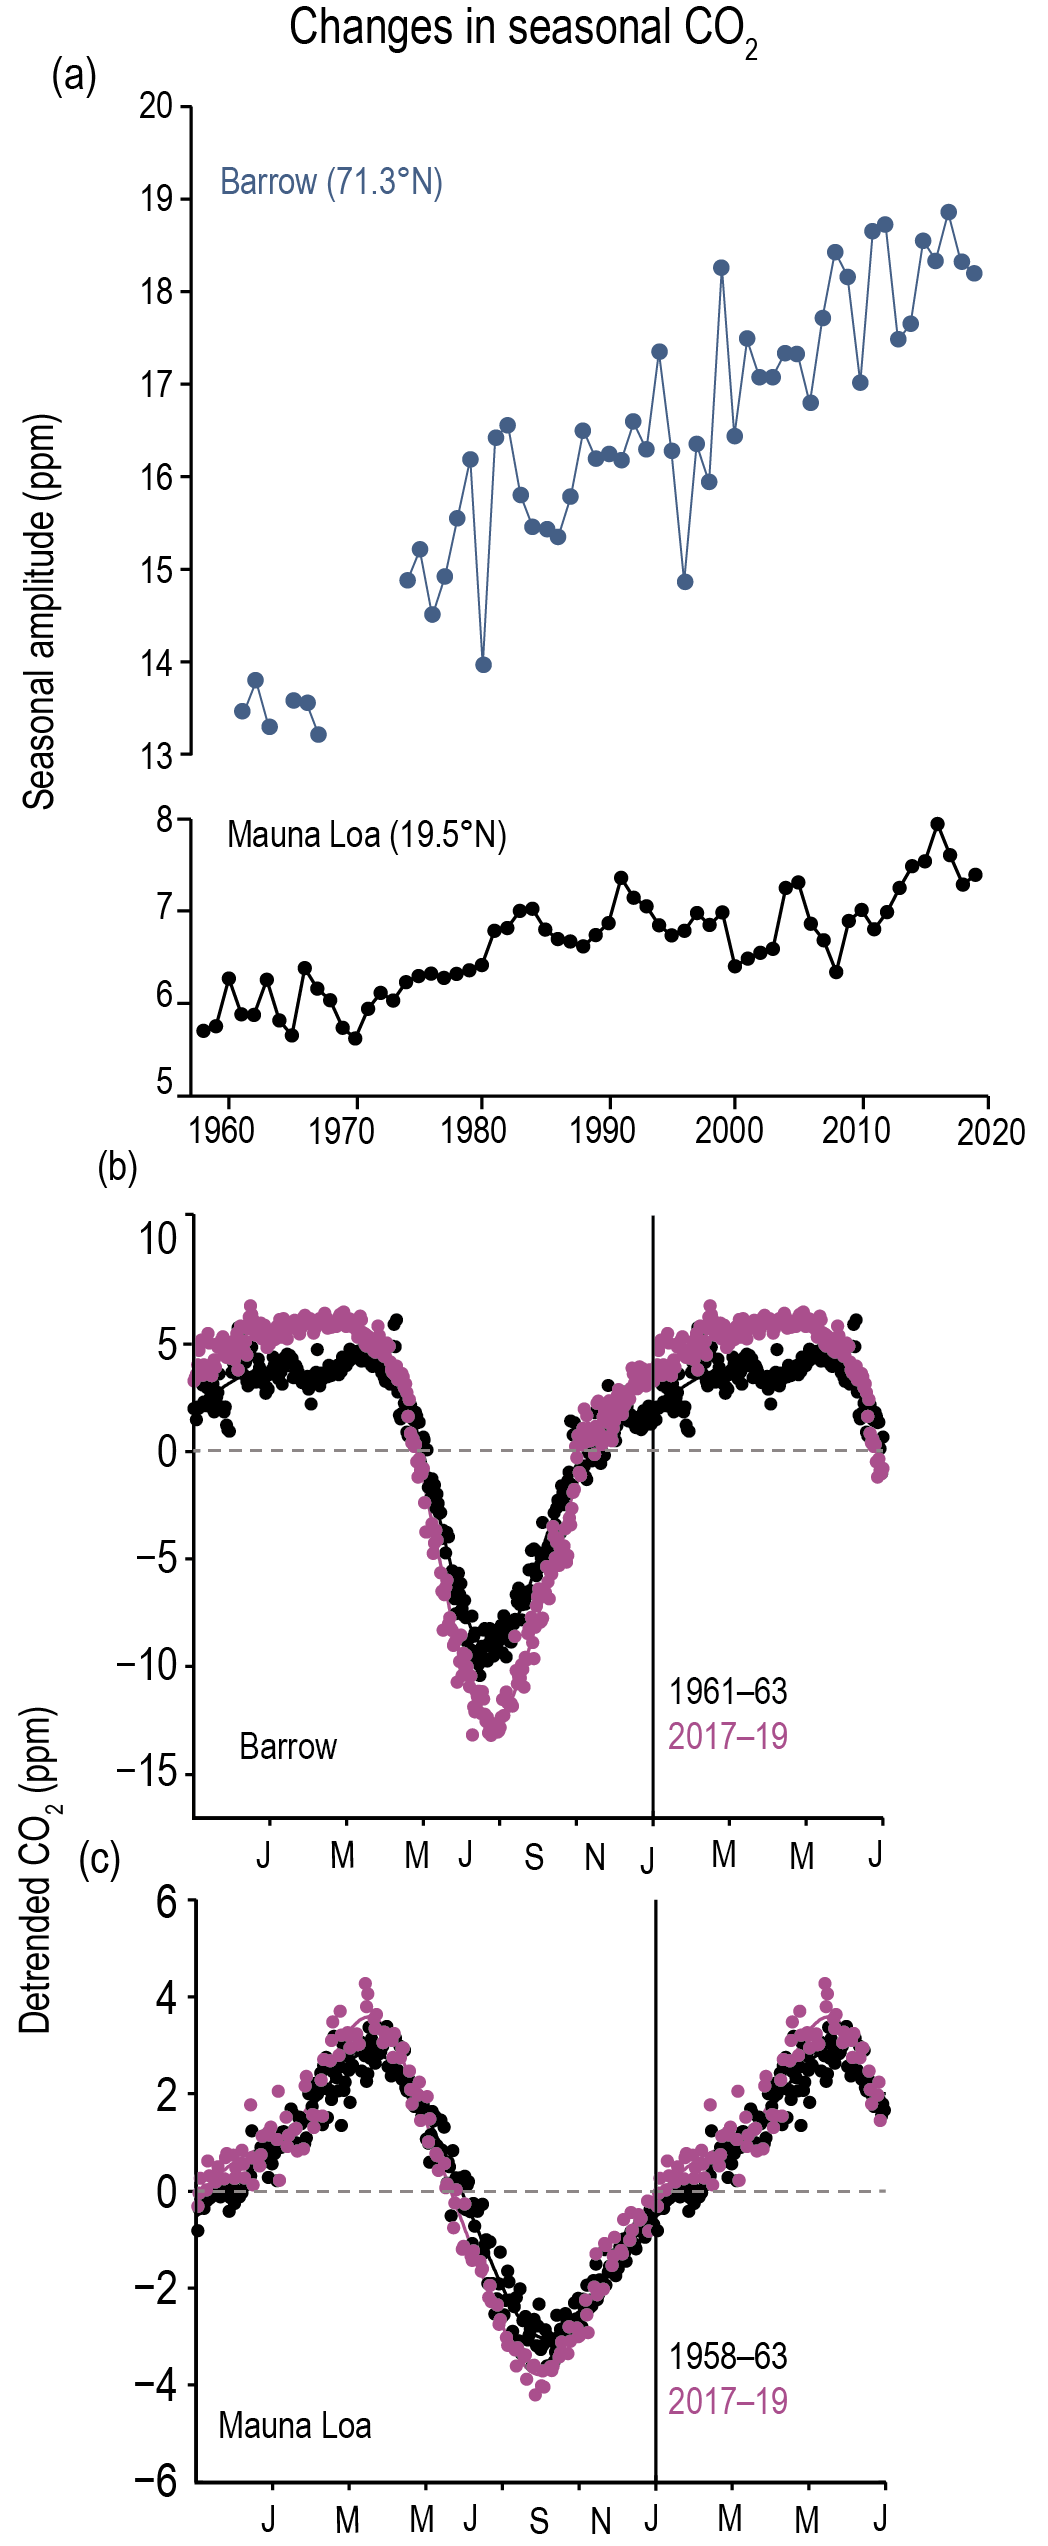
Figure caption
Figure 2.30 | Changes in the amplitude of the seasonal cycle of CO2. (a) Observed peak-to-trough seasonal amplitude given by the day of year of downward zero crossing, of CO2 concentration at Barrow (71°N, blue) and Mauna Loa (20°N, black). Seasonal CO2 cycles observed at (b) Barrow and (c) Mauna Loa for the 1961–1963 or 1958–1963 and 2017–2019 time periods. The first six months of the year are repeated. Reprinted with permission from AAAS. Further details on data sources and processing are available in the chapter data table (Table 2.SM.1).