Back chapter figures
Figure 2.31
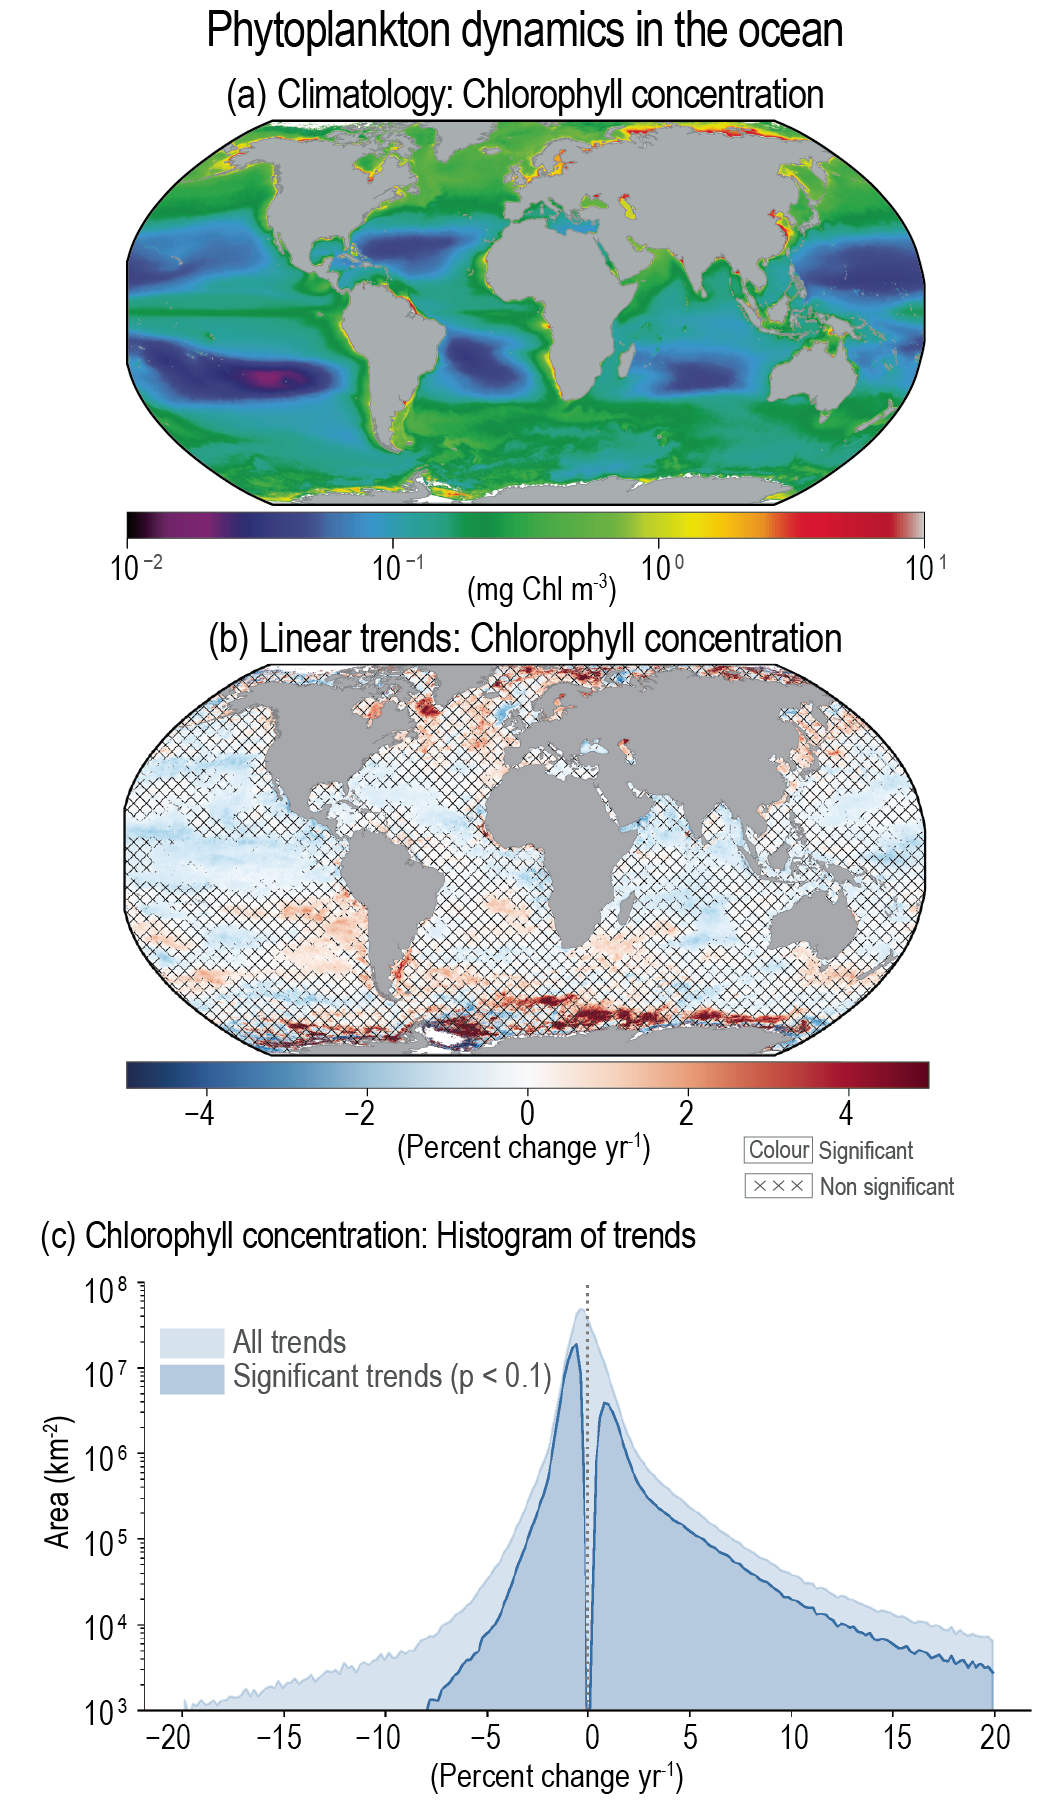
Figure caption
Figure 2. 31 | Phytoplankton dynamics in the ocean. (a) Climatology of chlorophyll-a concentration derived from ocean-colour data (1998–2018); (b) Linear trends in chlorophyll concentration. Trends are calculated using OLS regression with significance assessed following AR(1) adjustment after Santer et al. (2008) (‘×’ marks denote non-significant changes). (c) Histogram of linear trends in chlorophyll concentration, after area weighting and with per-pixel uncertainty estimates based on comparison with in situ data. Further details on data sources and processing are available in the chapter data table (Table 2.SM.1).