Back chapter figures
Figure 2.32
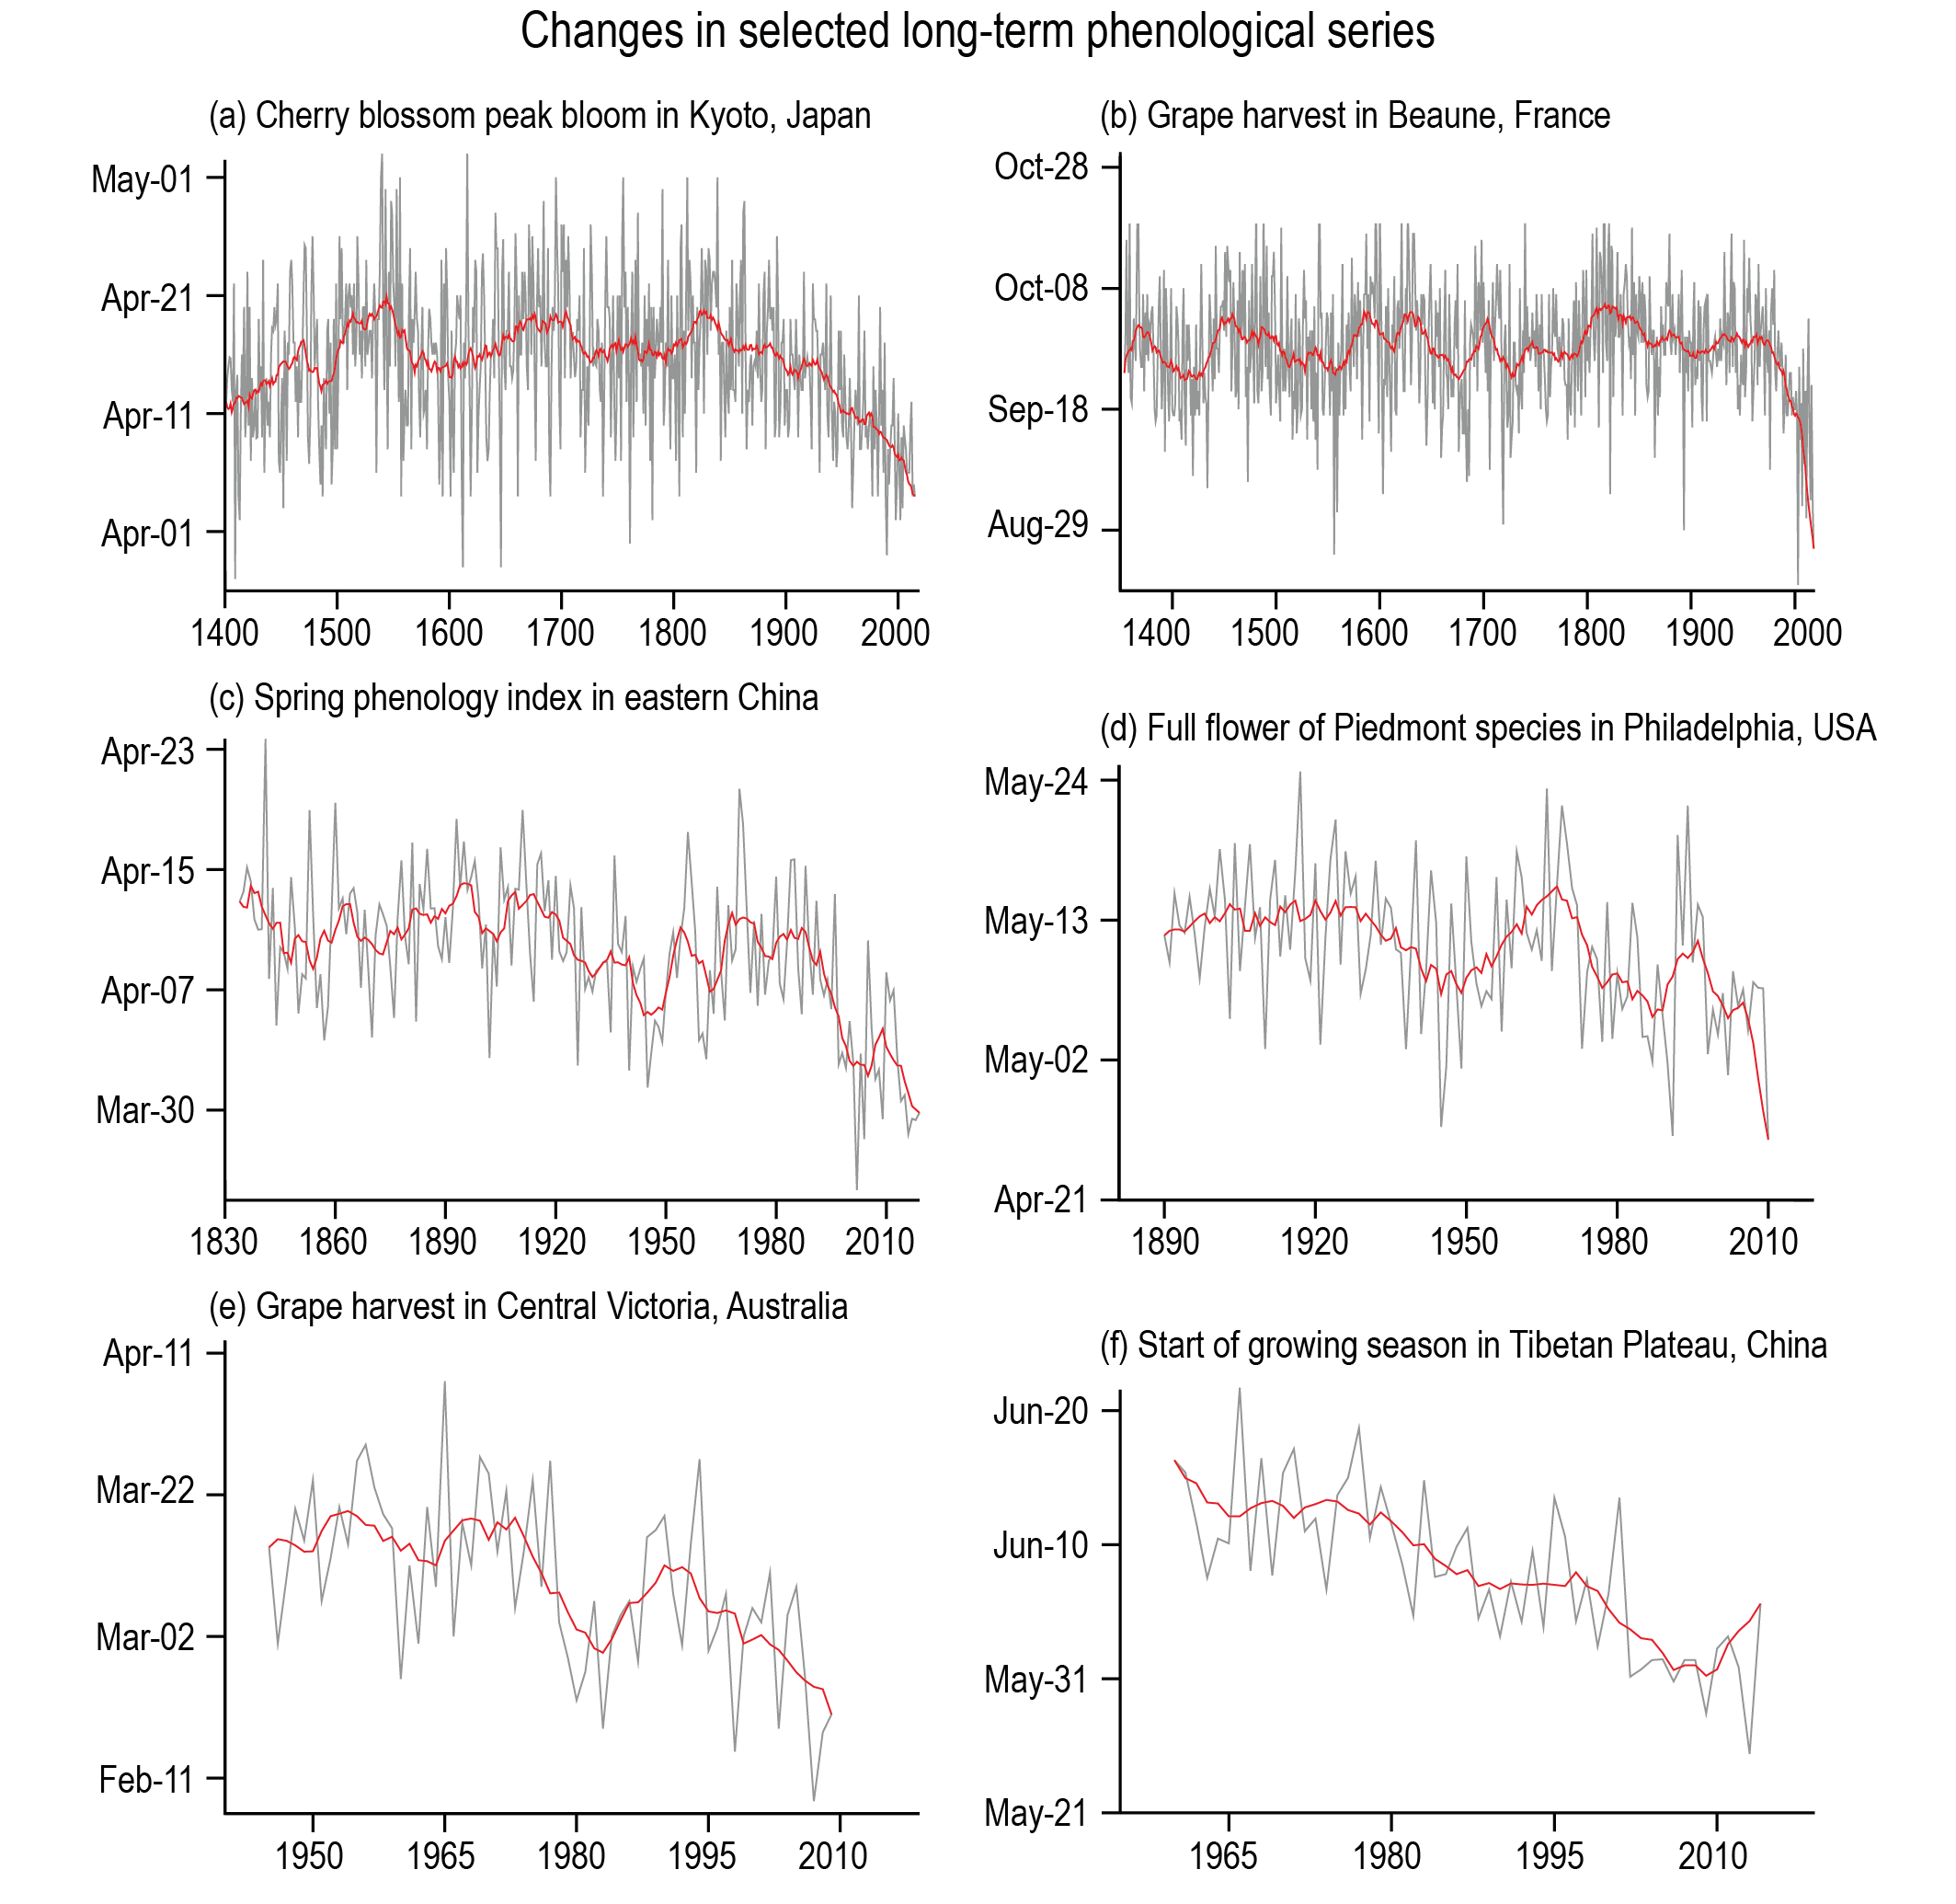
Figure caption
Figure 2.32 | Phenological indicators of changes in growing season. (a) Cherry blossom peak bloom in Kyoto, Japan; (b) grape harvest in Beaune, France; (c) spring phenology index in eastern China; (d) full flower of Piedmont species in Philadelphia, USA; (e) grape harvest in Central Victoria, Australia; (f) start of growing season in Tibetan Plateau, China. Red lines depict the 25-year moving average (top row) or the nine-year moving average (middle and bottom rows) with the minimum roughness boundary constraint of Mann (2004). Further details on data sources and processing are available in the chapter data table (Table 2.SM.1).