Back chapter figures
Figure 2.33
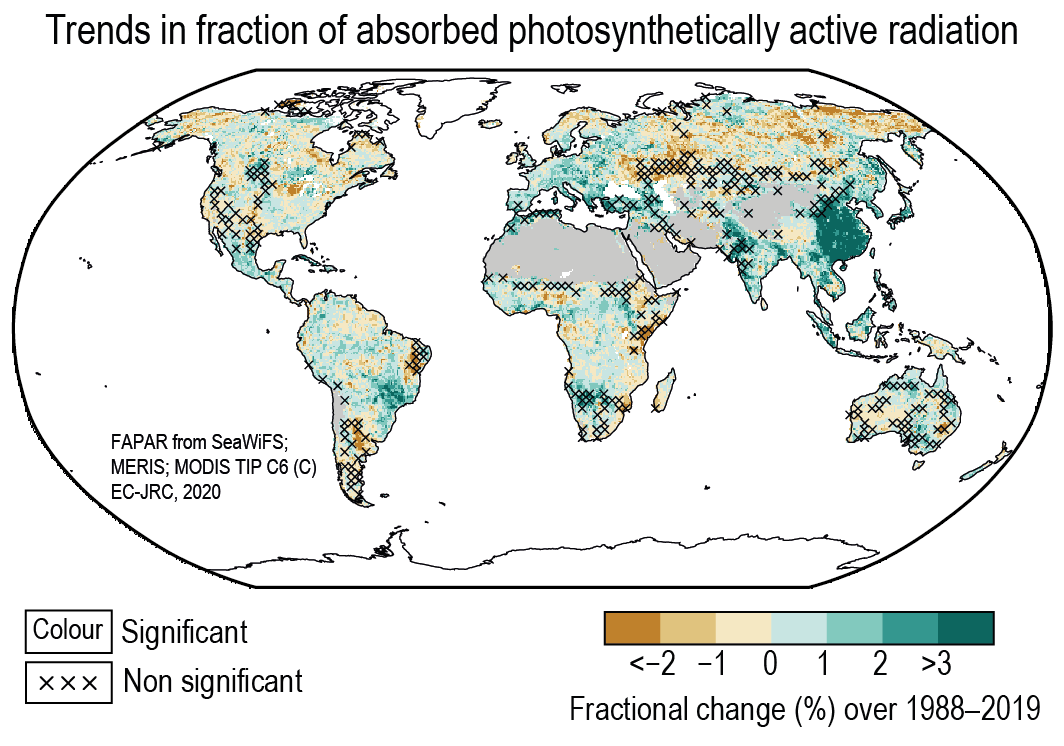
Figure caption
Figure 2. 33 | Satellite-based trends in fraction of absorbed photosynthetically active radiation (per decade) for 1998–2019. Trends are calculated using OLS regression with significance assessed following AR(1) adjustment after Santer et al. (2008); ‘×’ marks denote non-significant trend). Unvegetated areas such as barren deserts (grey) and ice sheets (white) have no trend in FAPAR. Further details on data sources and processing are available in the chapter data table (Table 2.SM.1).