Back chapter figures
Figure 2.34
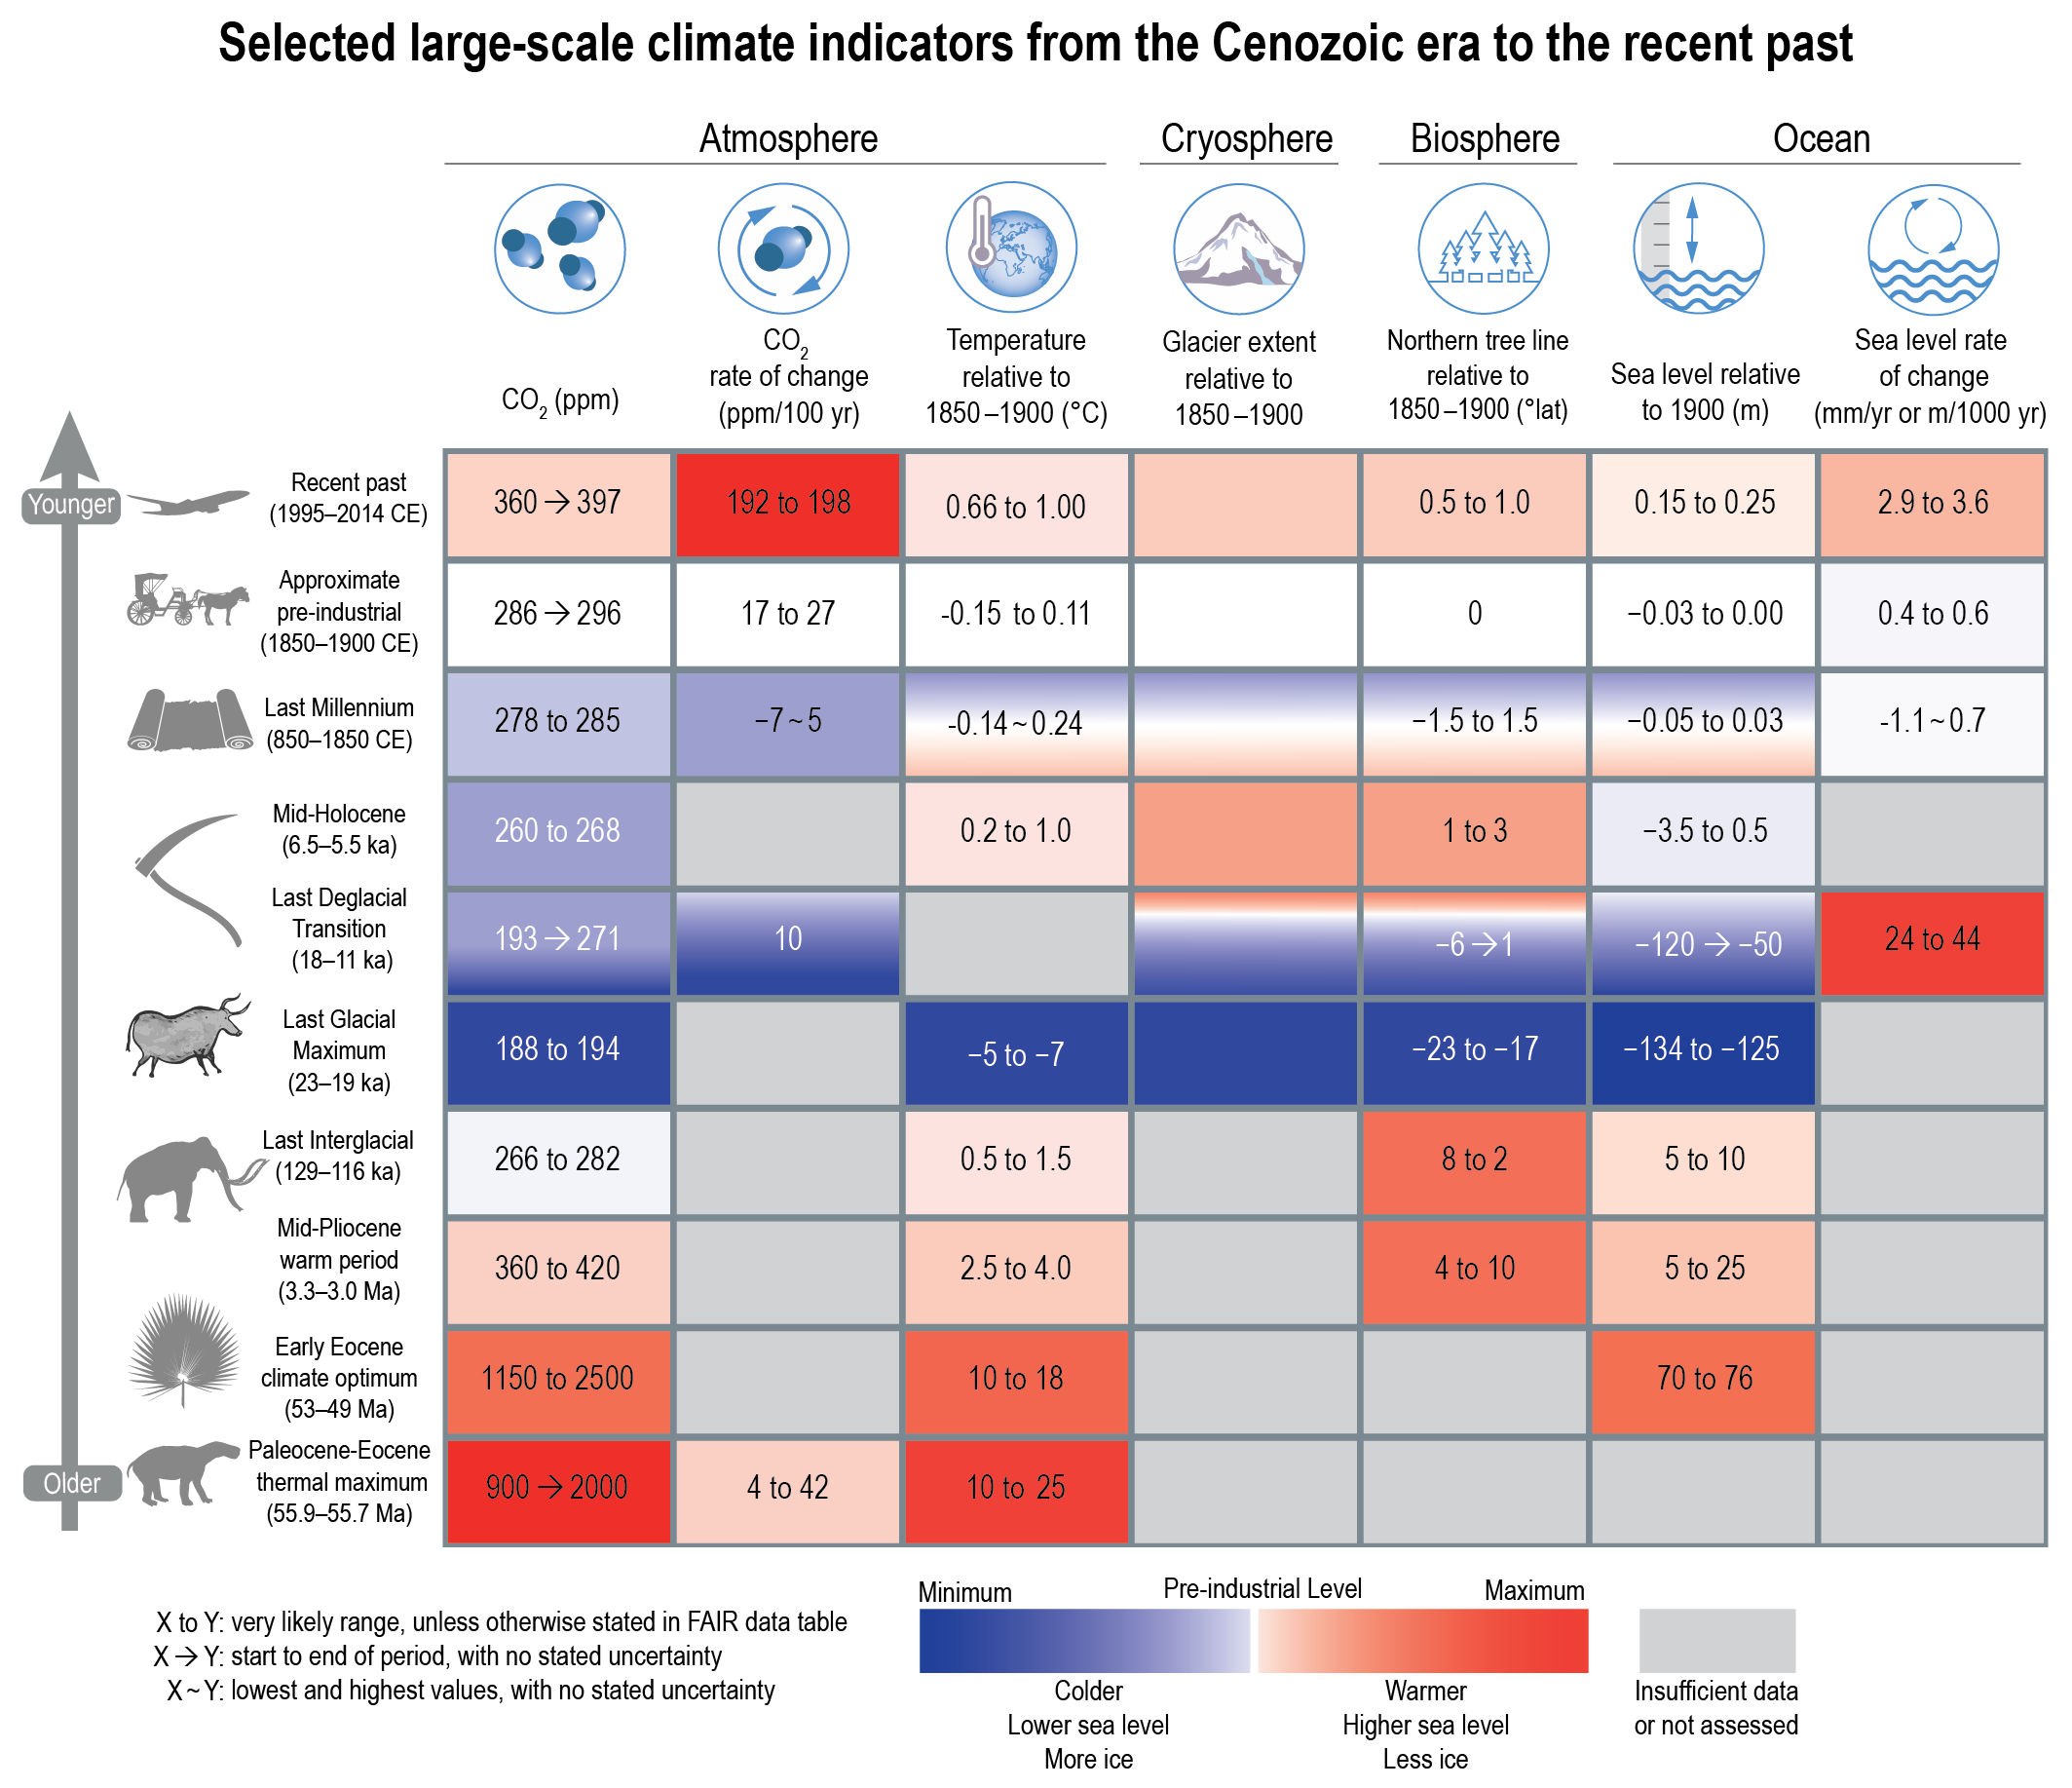
Figure caption
Figure 2.34 | Selected large-scale climate indicators during paleoclimate and recent reference periods of the Cenozoic Era. Values are based upon assessments carried out in this chapter, with confidence levels ranging fromlow tovery high. Refer to Cross-Chapter Box 2.1 for description of paleoclimate reference periods and Section 1.4.1 for recent reference periods. Values are reported as either the very likely range (x to y), or best estimates from beginning to end of the reference period with no stated uncertainty (x→y), or lowest and highest values with no stated uncertainty (x ~ y). Temperature is global mean surface temperature. Glacier extent is relative and colour scale is inverted so that more extensive glacier extent is intuitively blue.