Back chapter figures
Figure 2.36
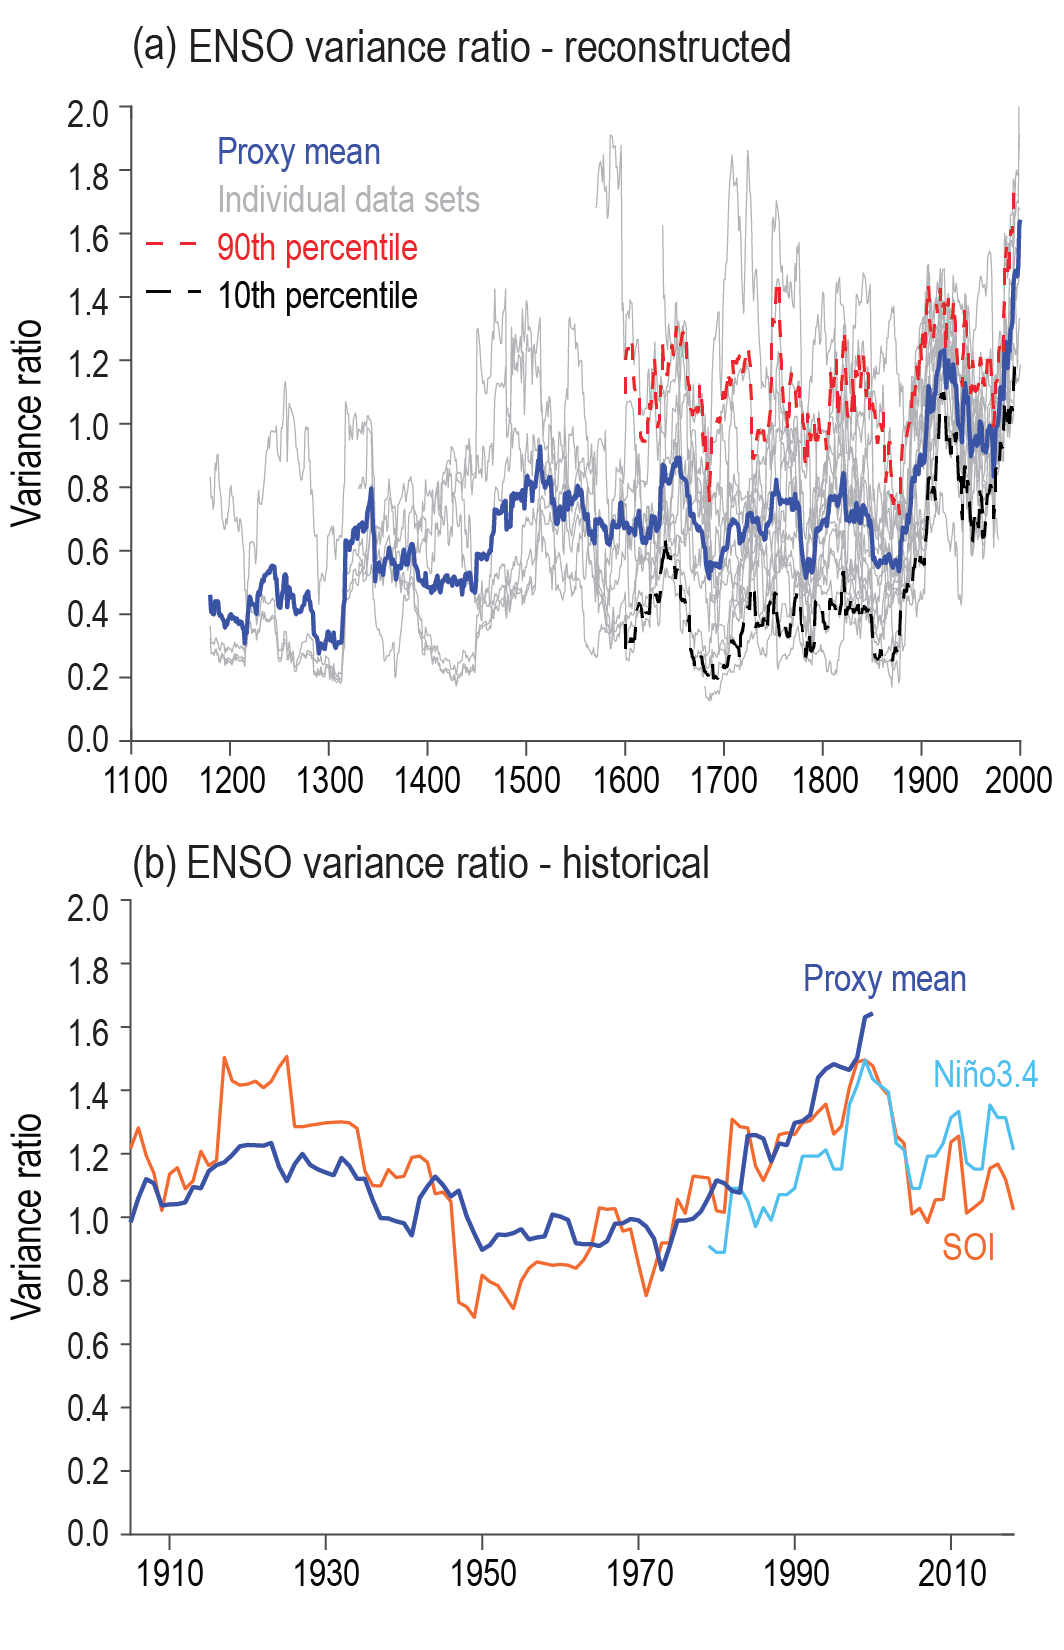
Figure caption
Figure 2.36 | Reconstructed and historical variance ratio of El Niño–Southern Oscillation (ENSO). (a) 30-year running variance of the reconstructed annual mean Niño 3.4 or related indicators from various published reconstructions. (b) Variance of June–November Southern Oscillation Index (SOI) and April–March mean Niño 3.4 (1981–2010 base period) along with the mean reconstruction from (a). Further details on data sources and processing are available in the chapter data table (Table 2.SM.1).