Back chapter figures
Figure 2.37
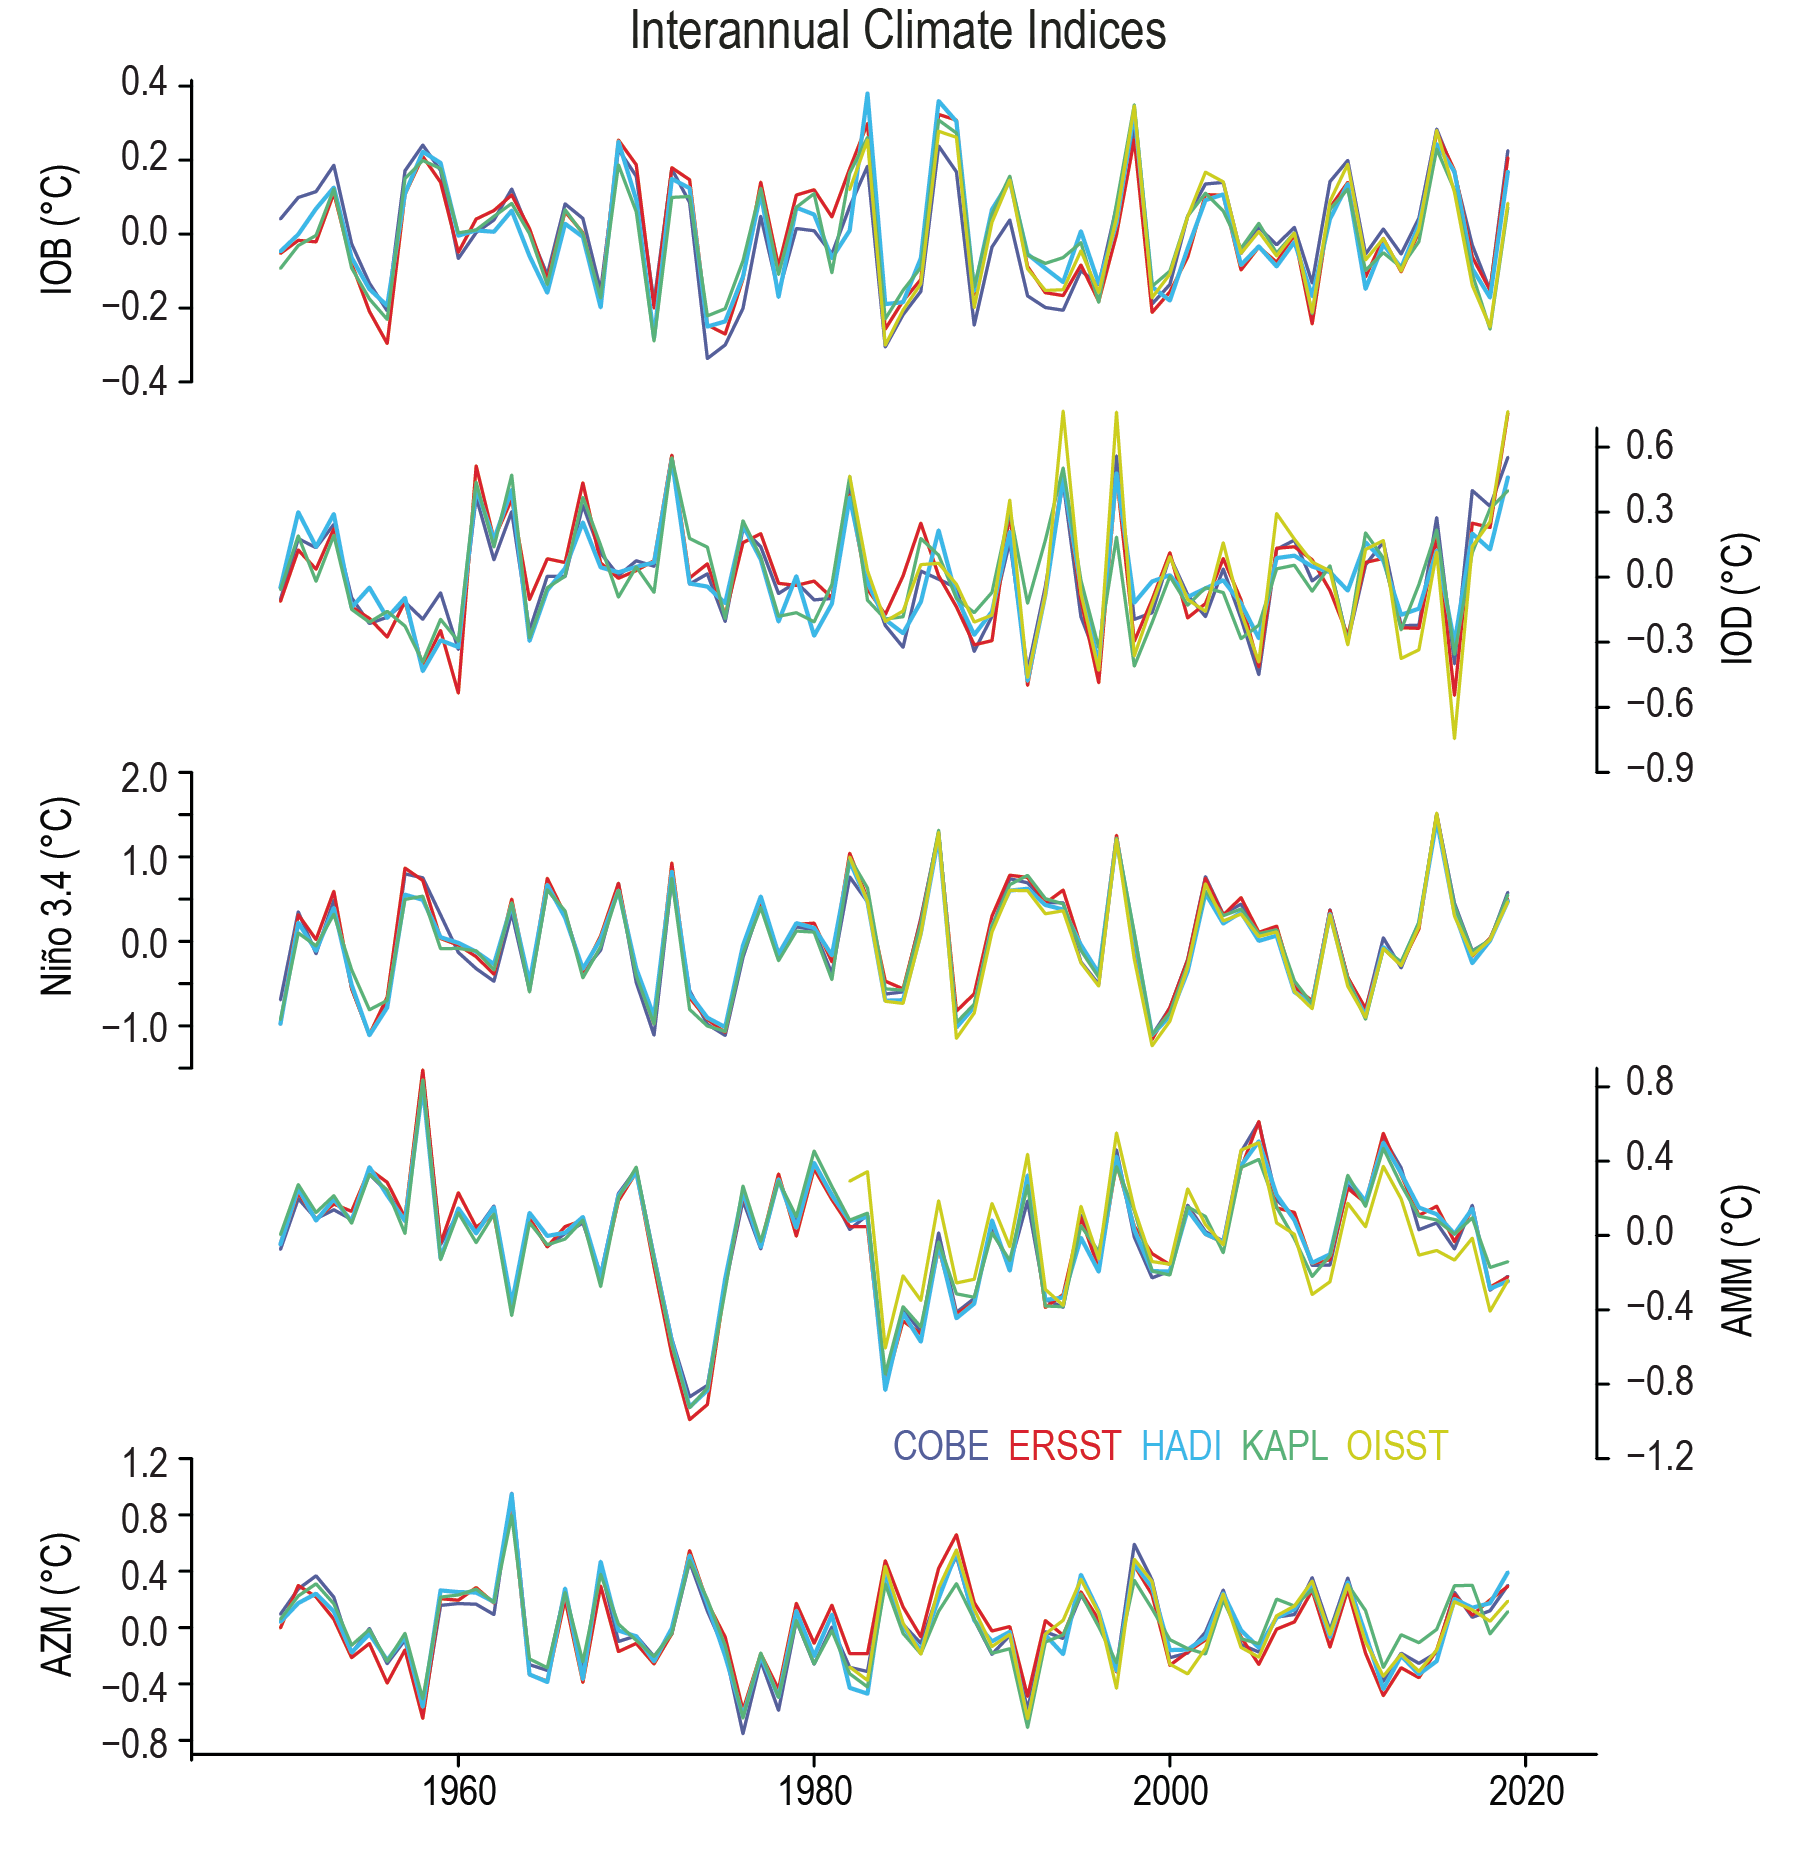
Figure caption
Figure 2.37 | Indices of interannual climate variability from 1950–2019 based upon several sea surface temperature data products. Shown are the following indices from top to bottom: IOB mode, IOD, Niño3.4, AMM and AZM. All indices are based on area-averaged annual data (see Annex IV). Further details on data sources and processing are available in the chapter data table (Table 2.SM.1).