Back chapter figures
Figure 2.4
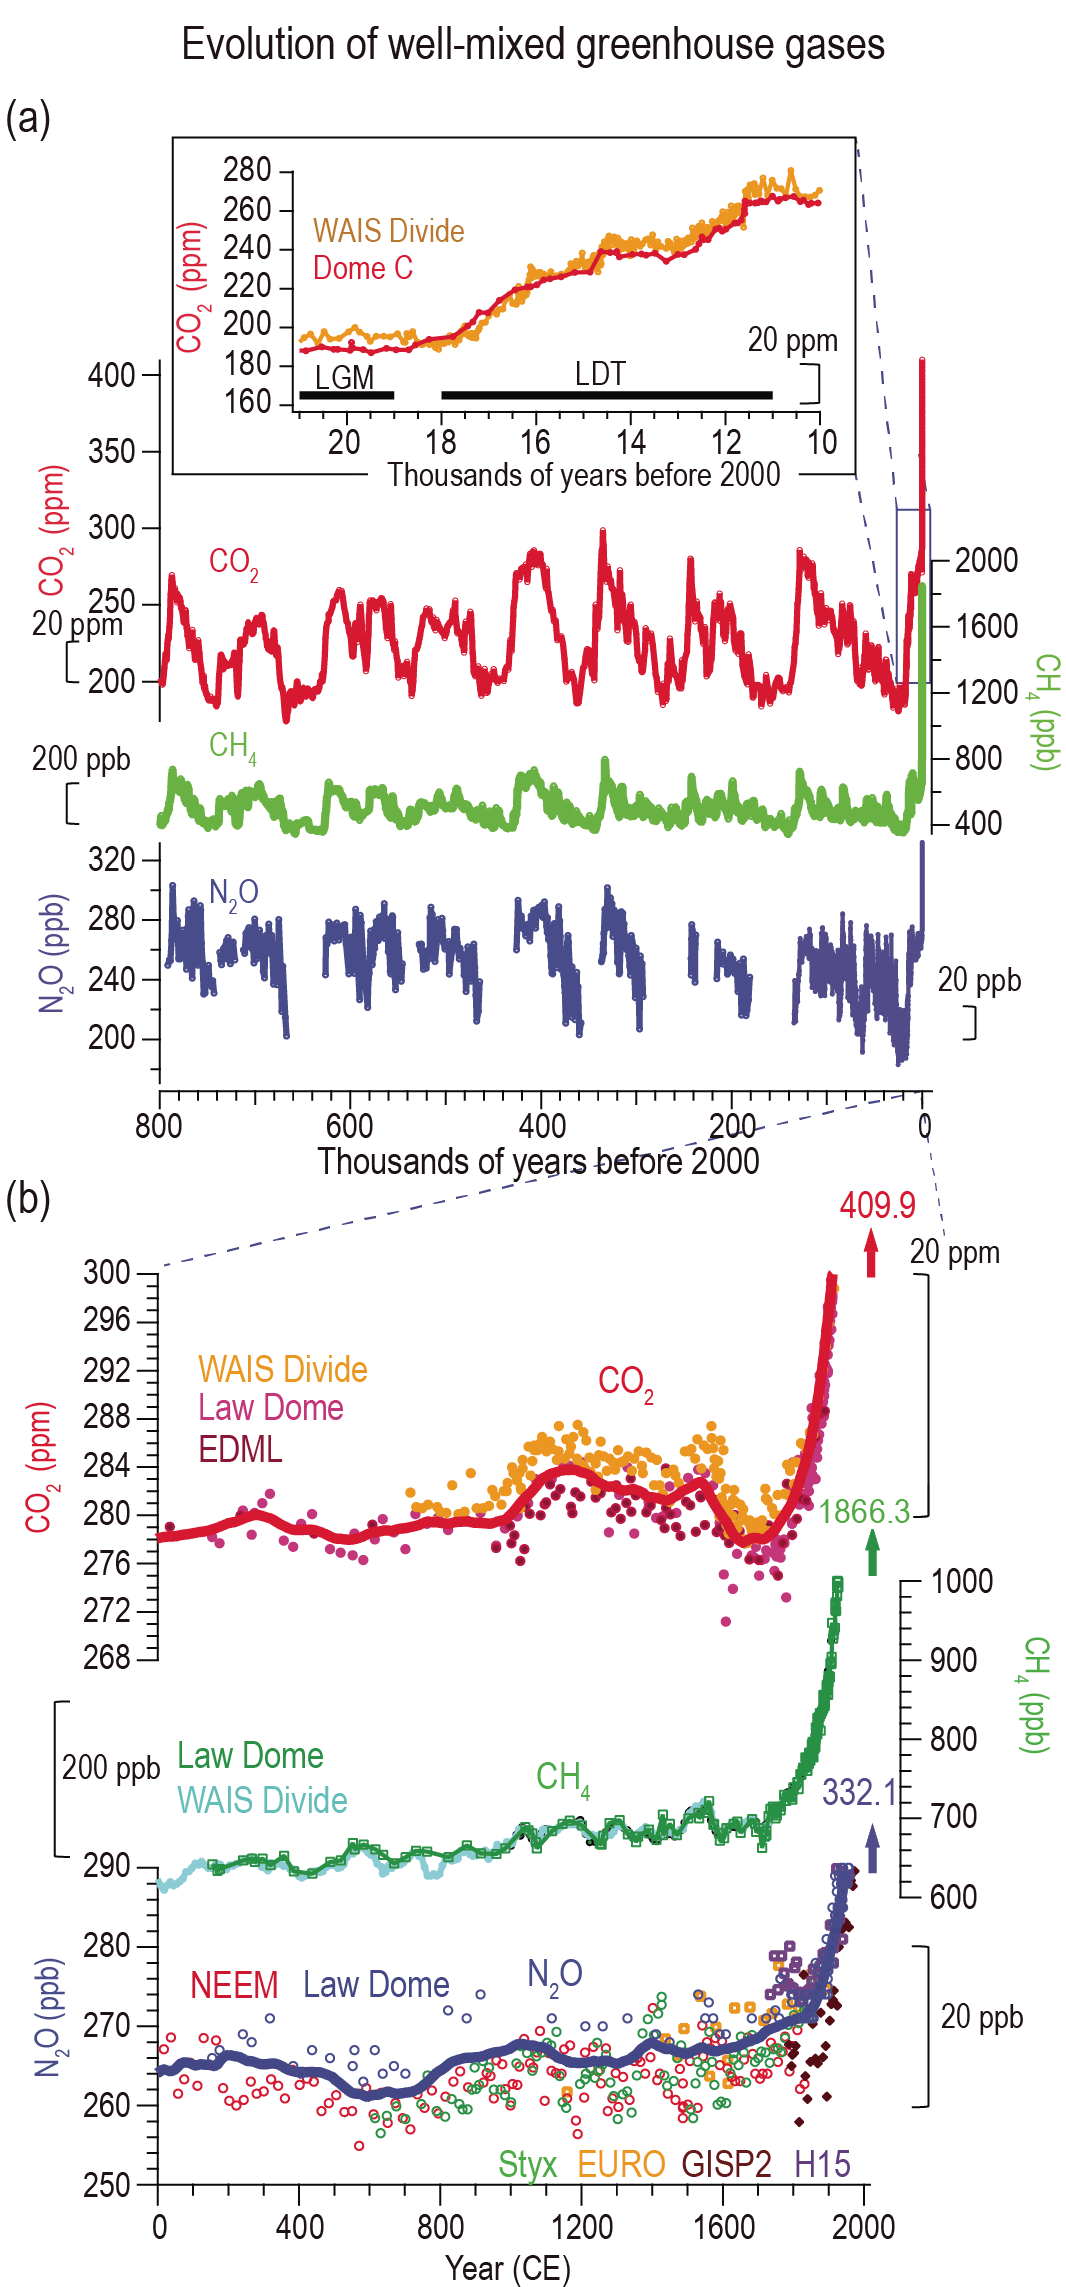
Figure caption
Figure 2.4 | Atmospheric well-mixed greenhouse gas (WMGHG) concentrationsfrom ice cores. (a) Records during the last 800 kyr with the Last Glacial Maximum (LGM) to Holocene transition as inset. (b) Multiple high-resolution records over the CE. The horizontal black bars in panel (a) inset indicate LGM and Last Deglacial Termination (LDT) respectively. The red and blue lines in (b) are 100-year running averages for CO2 and N2O concentrations, respectively. The numbers with vertical arrows in (b) are instrumentally measured concentrations in 2019. Further details on data sources and processing are available in the chapter data table (Table 2.SM.1).