Back chapter figures
Figure 2.7
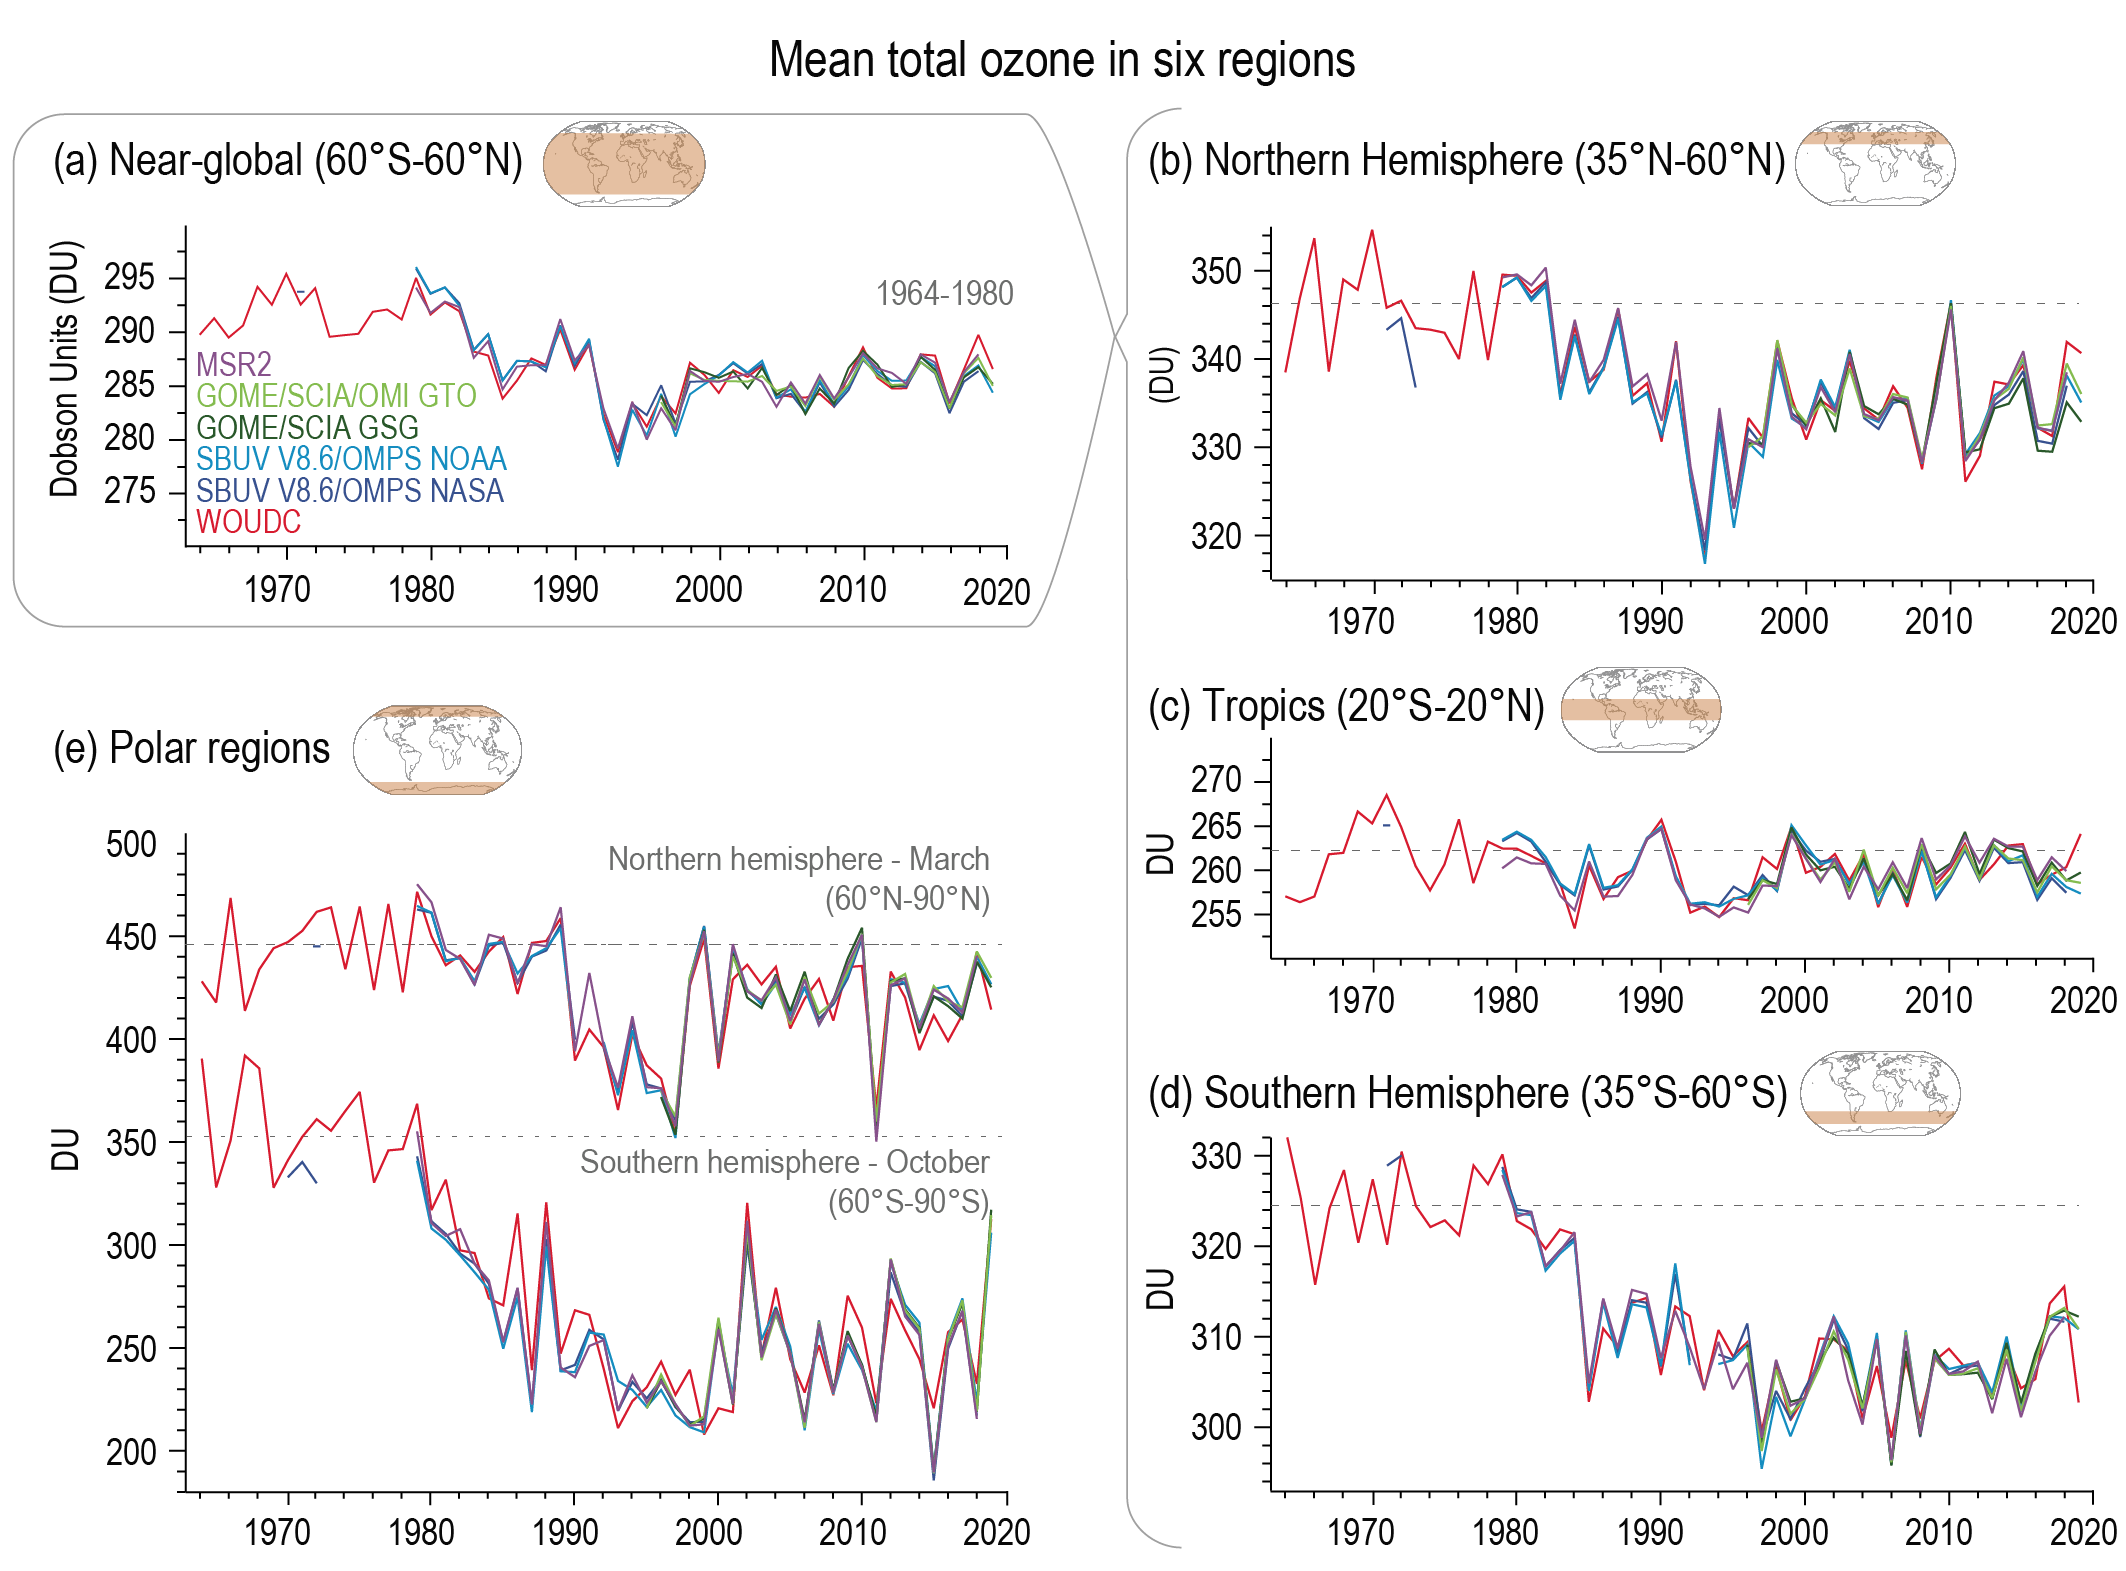
Figure caption
Figure 2.7 | Time series of annual mean total column ozone from 1964–2019. Values are in Dobson Units (DU), a good proxy for vertically integrated stratospheric ozone. Time series are shown for (a) near-global domain; (b–d) three zonal bands; and (e) polar (60°–90°) total ozone in March (Northern Hemisphere) and October (Southern Hemisphere): the months when polar ozone losses usually are largest. Further details on data sources and processing are available in the chapter data table (Table 2.SM.1).