Back chapter figures
Figure 2.8
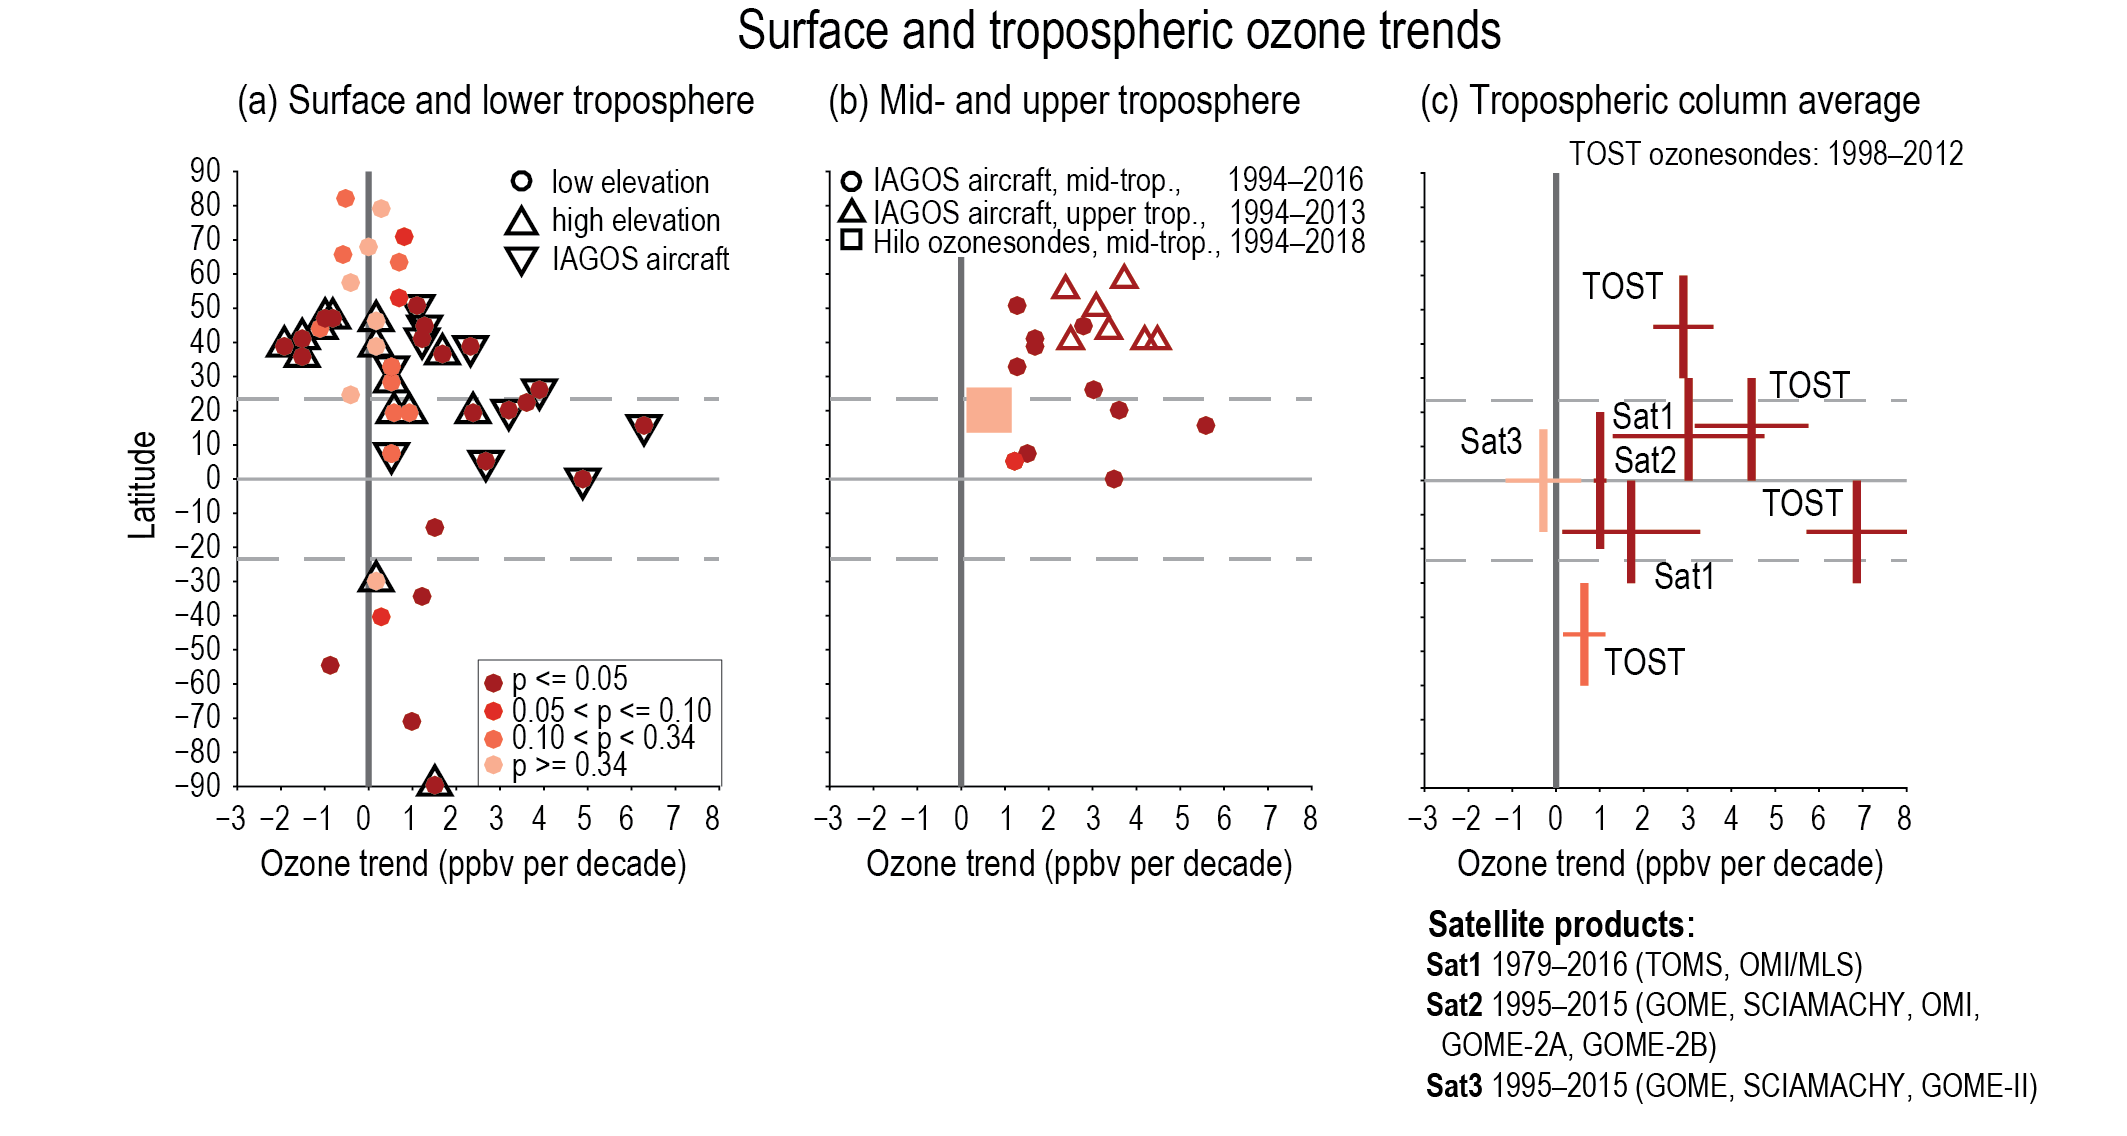
Figure caption
Figure 2.8 | Surface and tropospheric ozone trends. (a) Decadal ozone trends by latitude at 28 remote surface sites and in the lower free troposphere (650 hPa, about 3.5 km) as measured by IAGOS aircraft above 11 regions. All trends are estimated for the time series up to the most recently available year, but begin in 1995 or 1994. Colours indicate significance (p-value) as denoted in the in-line key. See Figure 6.5 for a depiction of these trends globally. (b) Trends of ozone since 1994 as measured by IAGOS aircraft in 11 regions in the mid-troposphere (700–300 hPa; about 3–9 km) and upper troposphere (about 10–12 km), as measured by IAGOS aircraft and ozonesondes. (c) Trends of average tropospheric column ozone mixing ratios from the TOST composite ozonesonde product and three composite satellite products based on TOMS, OMI/MLS (Sat1), GOME, SCIAMACHY, OMI, GOME-2A, GOME-2B (Sat2), and GOME, SCIAMACHY, GOME-II (Sat3). Vertical bars indicate the latitude range of each product, while horizontal lines indicate the very likely uncertainty range. Further details on data sources and processing are available in the chapter data table (Table 2.SM.1).