Back chapter figures
Figure 2.9
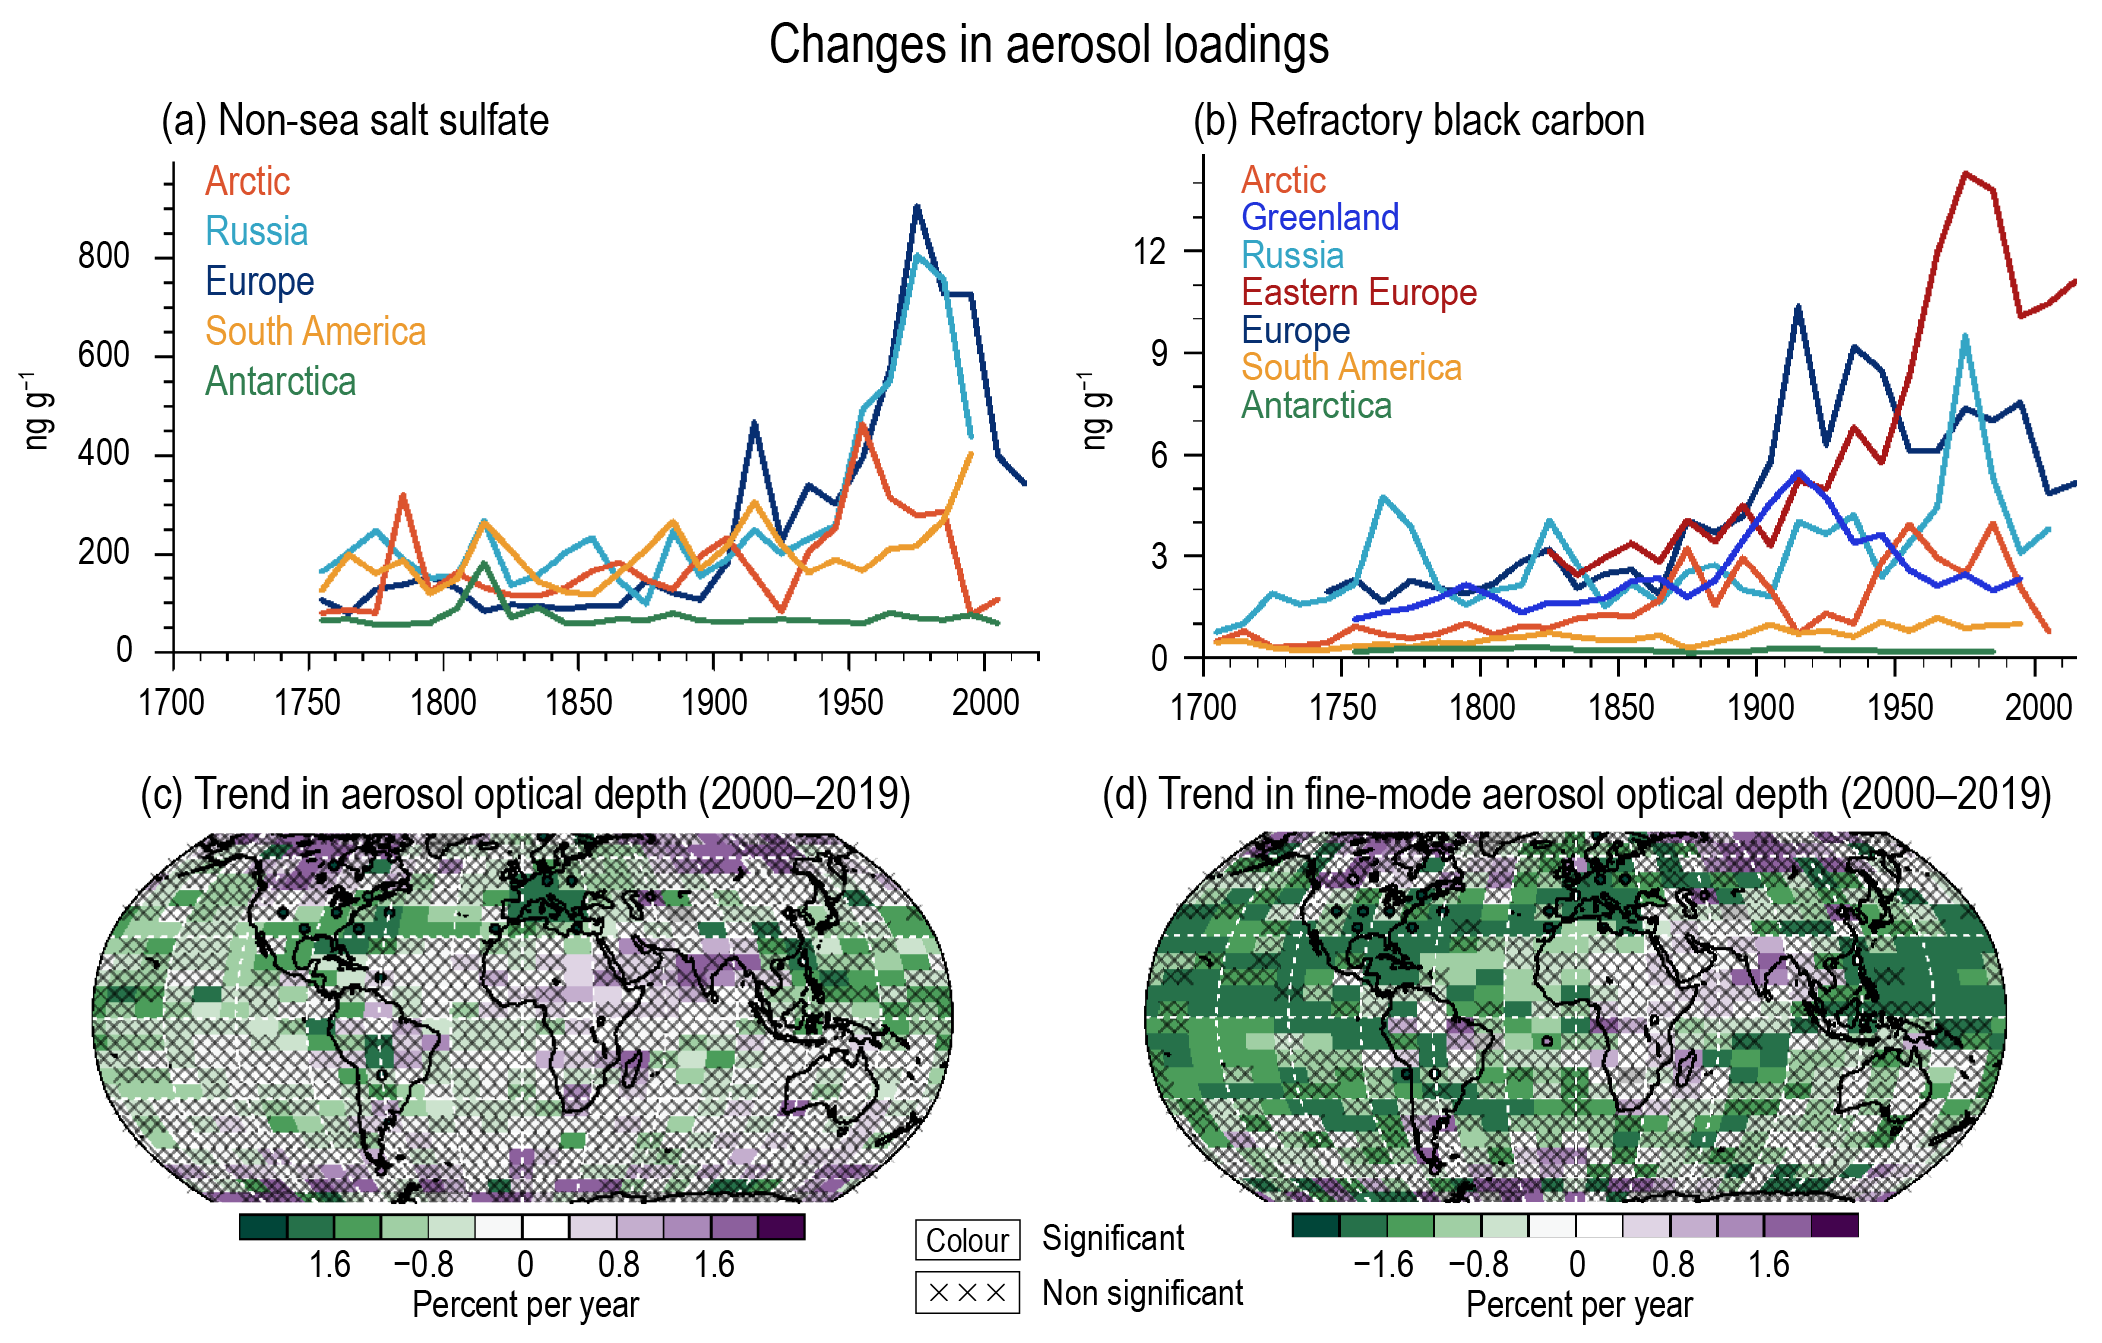
Figure caption
Figure 2.9 | Aerosol evolution from ice-core measurements. Changes are shown as 10-year averaged time series (a, b) and trends in remote-sensing aerosol optical depth (AOD) and AODf (c, d). (a) Concentrations of non-sea salt (nss) sulphate (ng g–1). (b) Black carbon (BC) in glacier ice from the Arctic (Lomonosovfonna), Russia (Belukha), Europe (Colle Gnifetti), South America (Illimani), Antarctica (stacked sulphate record, and BC from the B40 core), and BC from Greenland (stacked rBC record from Greenland and eastern Europe (Elbrus)). (c) Linear trend in annual mean AOD retrieved from satellite data for the 2000–2019 period (% yr–1). The average trend from MODerate Resolution Imaging Spectroradiometer (MODIS) and Multi-Angle Imaging Spectroradiometer (MISR) is shown. Trends are calculated using OLS regression with significance assessed following AR(1) adjustment after Santer et al. (2008). Superimposed are the trends in annual-mean AOD from the AERONET surface sunphotometer network for 2000–2019. (d) Linear trend in 2000–2019 as in (c), but for fine-mode AOD, AODf, and using only MISR over land. ‘×’ marks denote non-significant trends. Further details on data sources and processing are available in the chapter data table (Table 2.SM.1).