Cross-Chapter Box 3.1, Figure 1
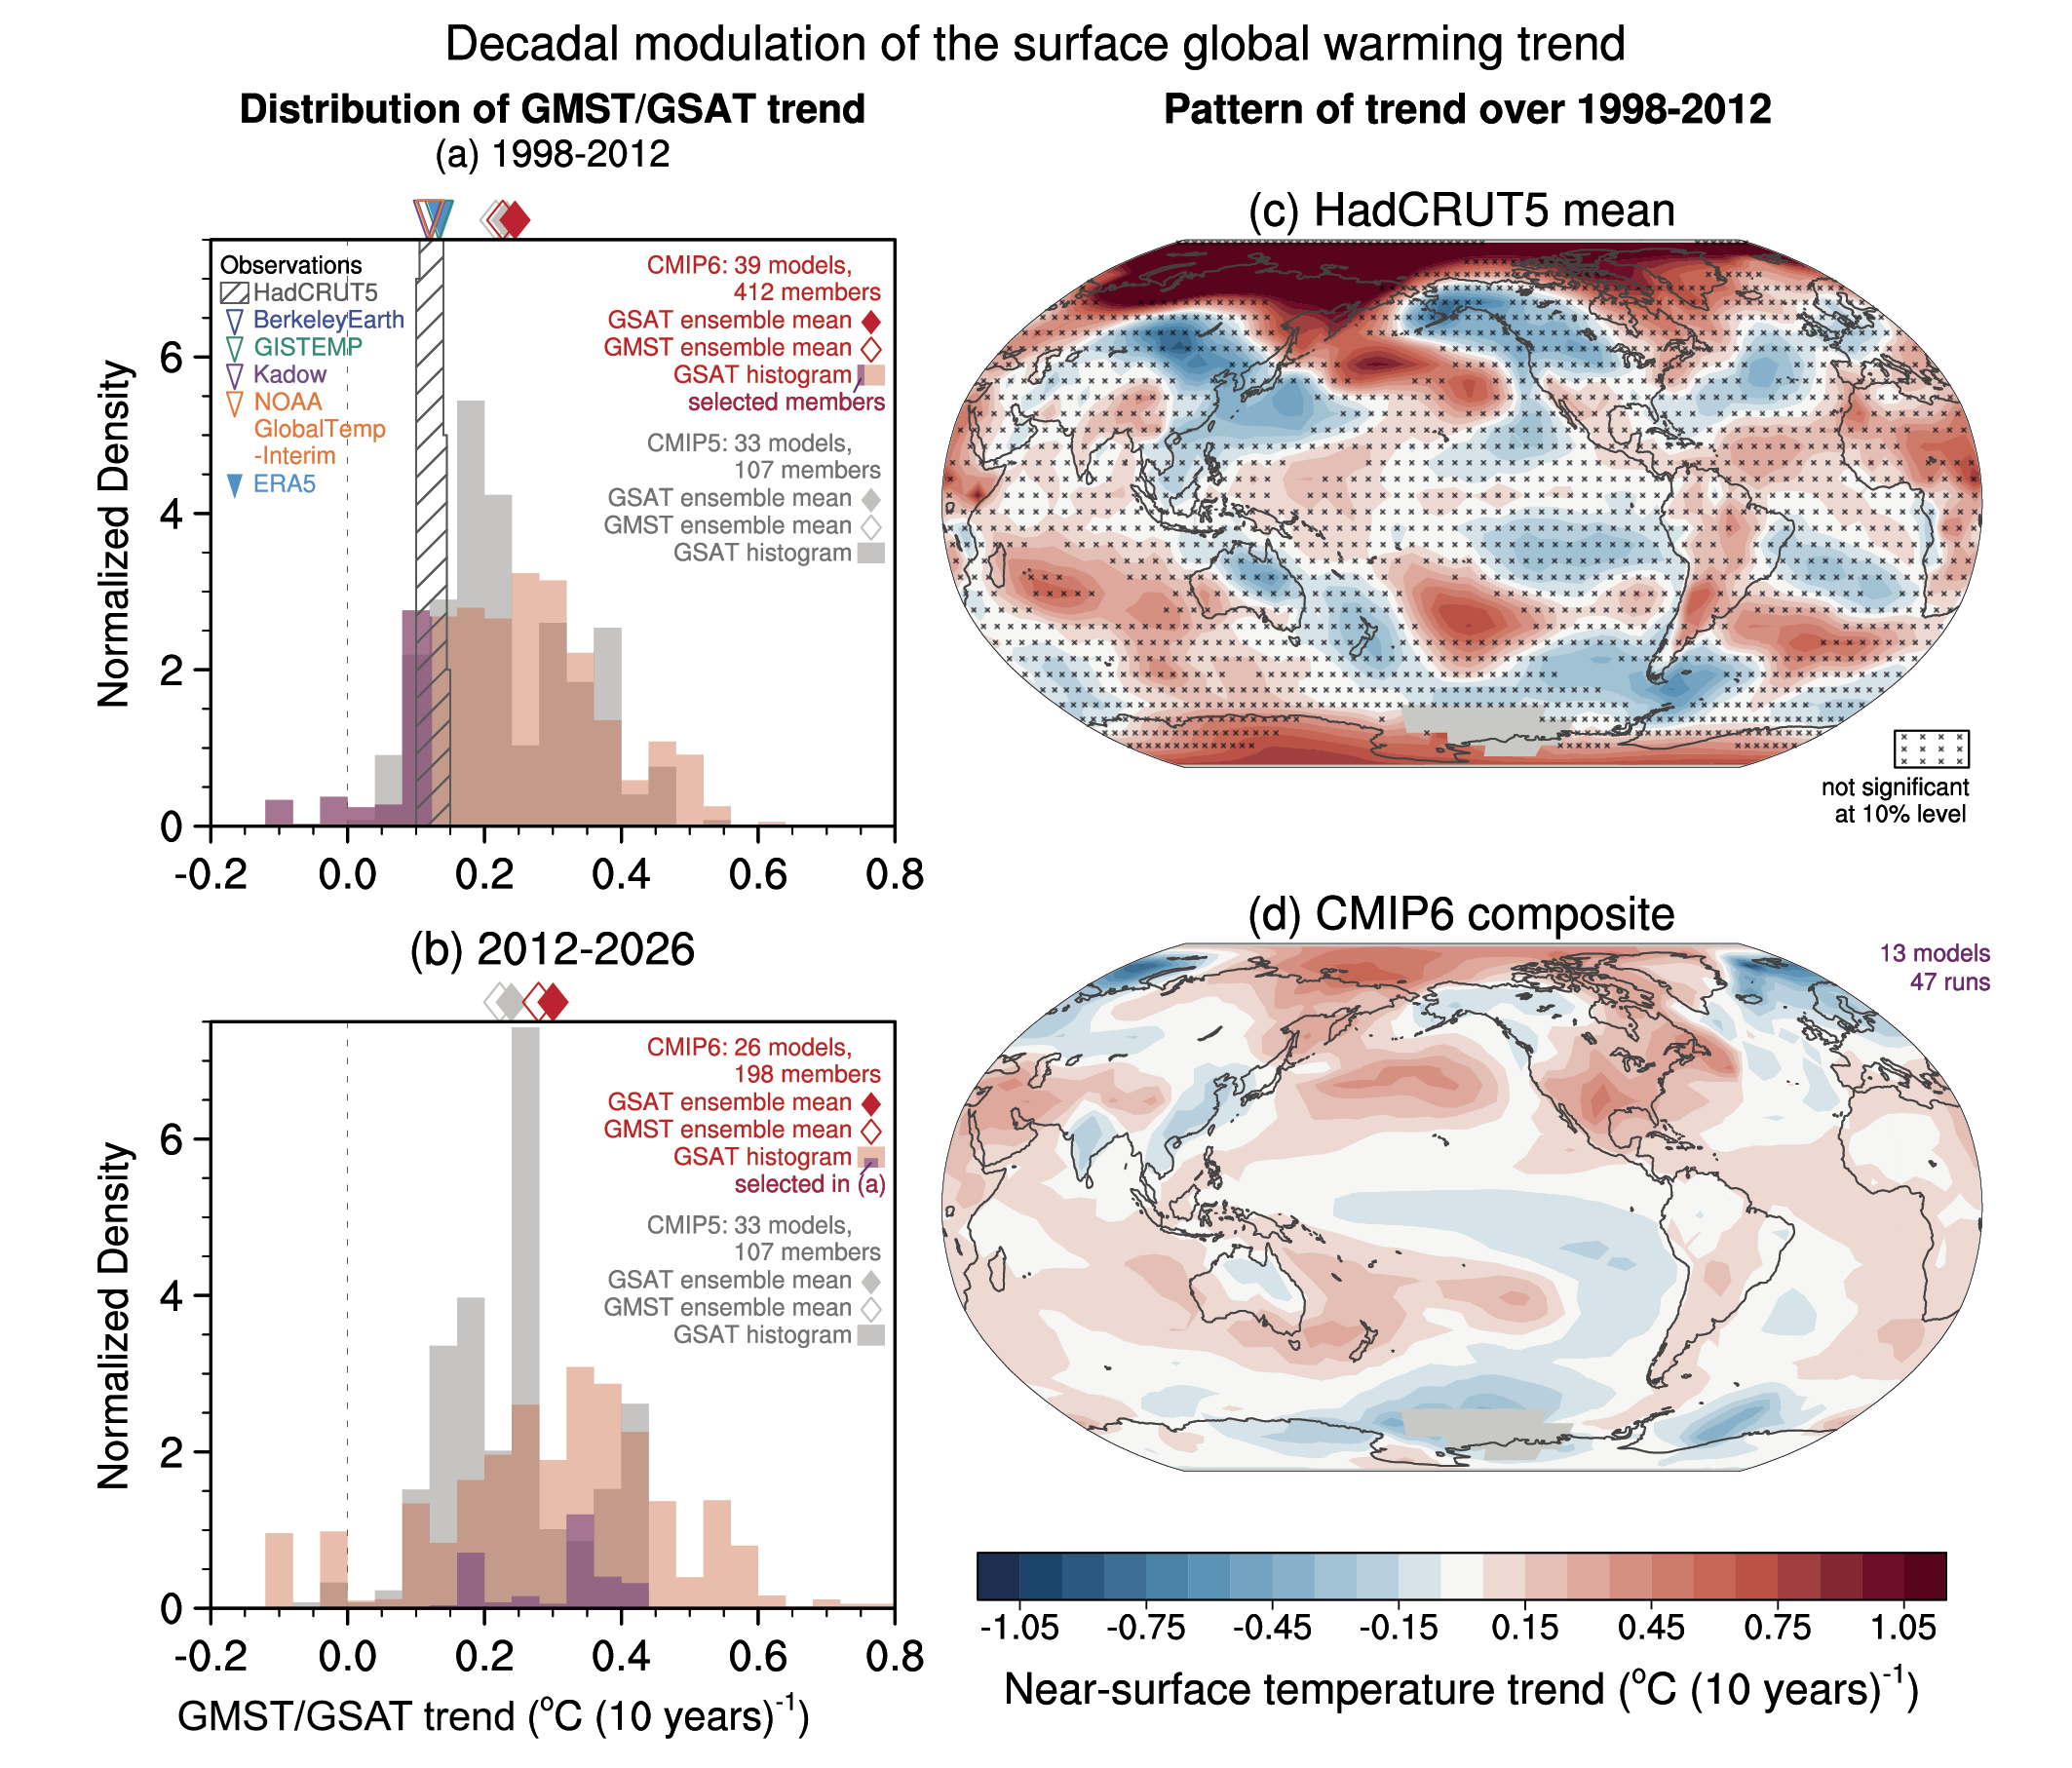
Figure caption
Cross-Chapter Box 3.1, Figure 1 | 15-year trends of global surface temperature for 1998–2012 and 2012–2026. (a, b) GSAT and GMST trends for 1998–2012 (a) and 2012–2026 (b). Histograms are based on GSAT in historical simulations of CMIP6 (red shading, extended by SSP2-4.5) and CMIP5 (grey shading; extended by RCP4.5). Filled and open diamonds at the top represent multi-model ensemble means of GSAT and GMST trends, respectively. Diagonal lines show histograms of HadCRUT5.0.1.0. Triangles at the top of (a) represent GMST trends from Berkeley Earth, GISTEMP, Kadow et al. (2020) and NOAAGlobalTemp-Interim, and the GSAT trend from ERA5. Selected CMIP6 members whose 1998–2012 trends are lower than the HadCRUT5.0.1.0 mean trend are indicated by purple shading (a) and (b). In (a), model GMST and GSAT, and ERA5 GSAT are masked to match HadCRUT data coverage. (c–d) Trend maps of annual near-surface temperature for 1998–2012 based on HadCRUT5.0.1.0 mean (c), and composited surface air temperature trends of subsampled CMIP6 simulations (d) with GSAT trends in the purple shadedarea in (a). In (c), cross marks indicate trends that are not significant at the 10% level based on t-tests with serial correlation taken into account. The ensemble size used for each of the histograms and the trend composite is indicated at the top right of each of the panels (a, b, d). Model ensemble members are weighted with the inverse of the ensemble size of the same model, so that each model is equally weighted. Further details on data sources and processing are available in the chapter data table (Table 3.SM.1).