Cross-Chapter Box 3.2, Figure 1
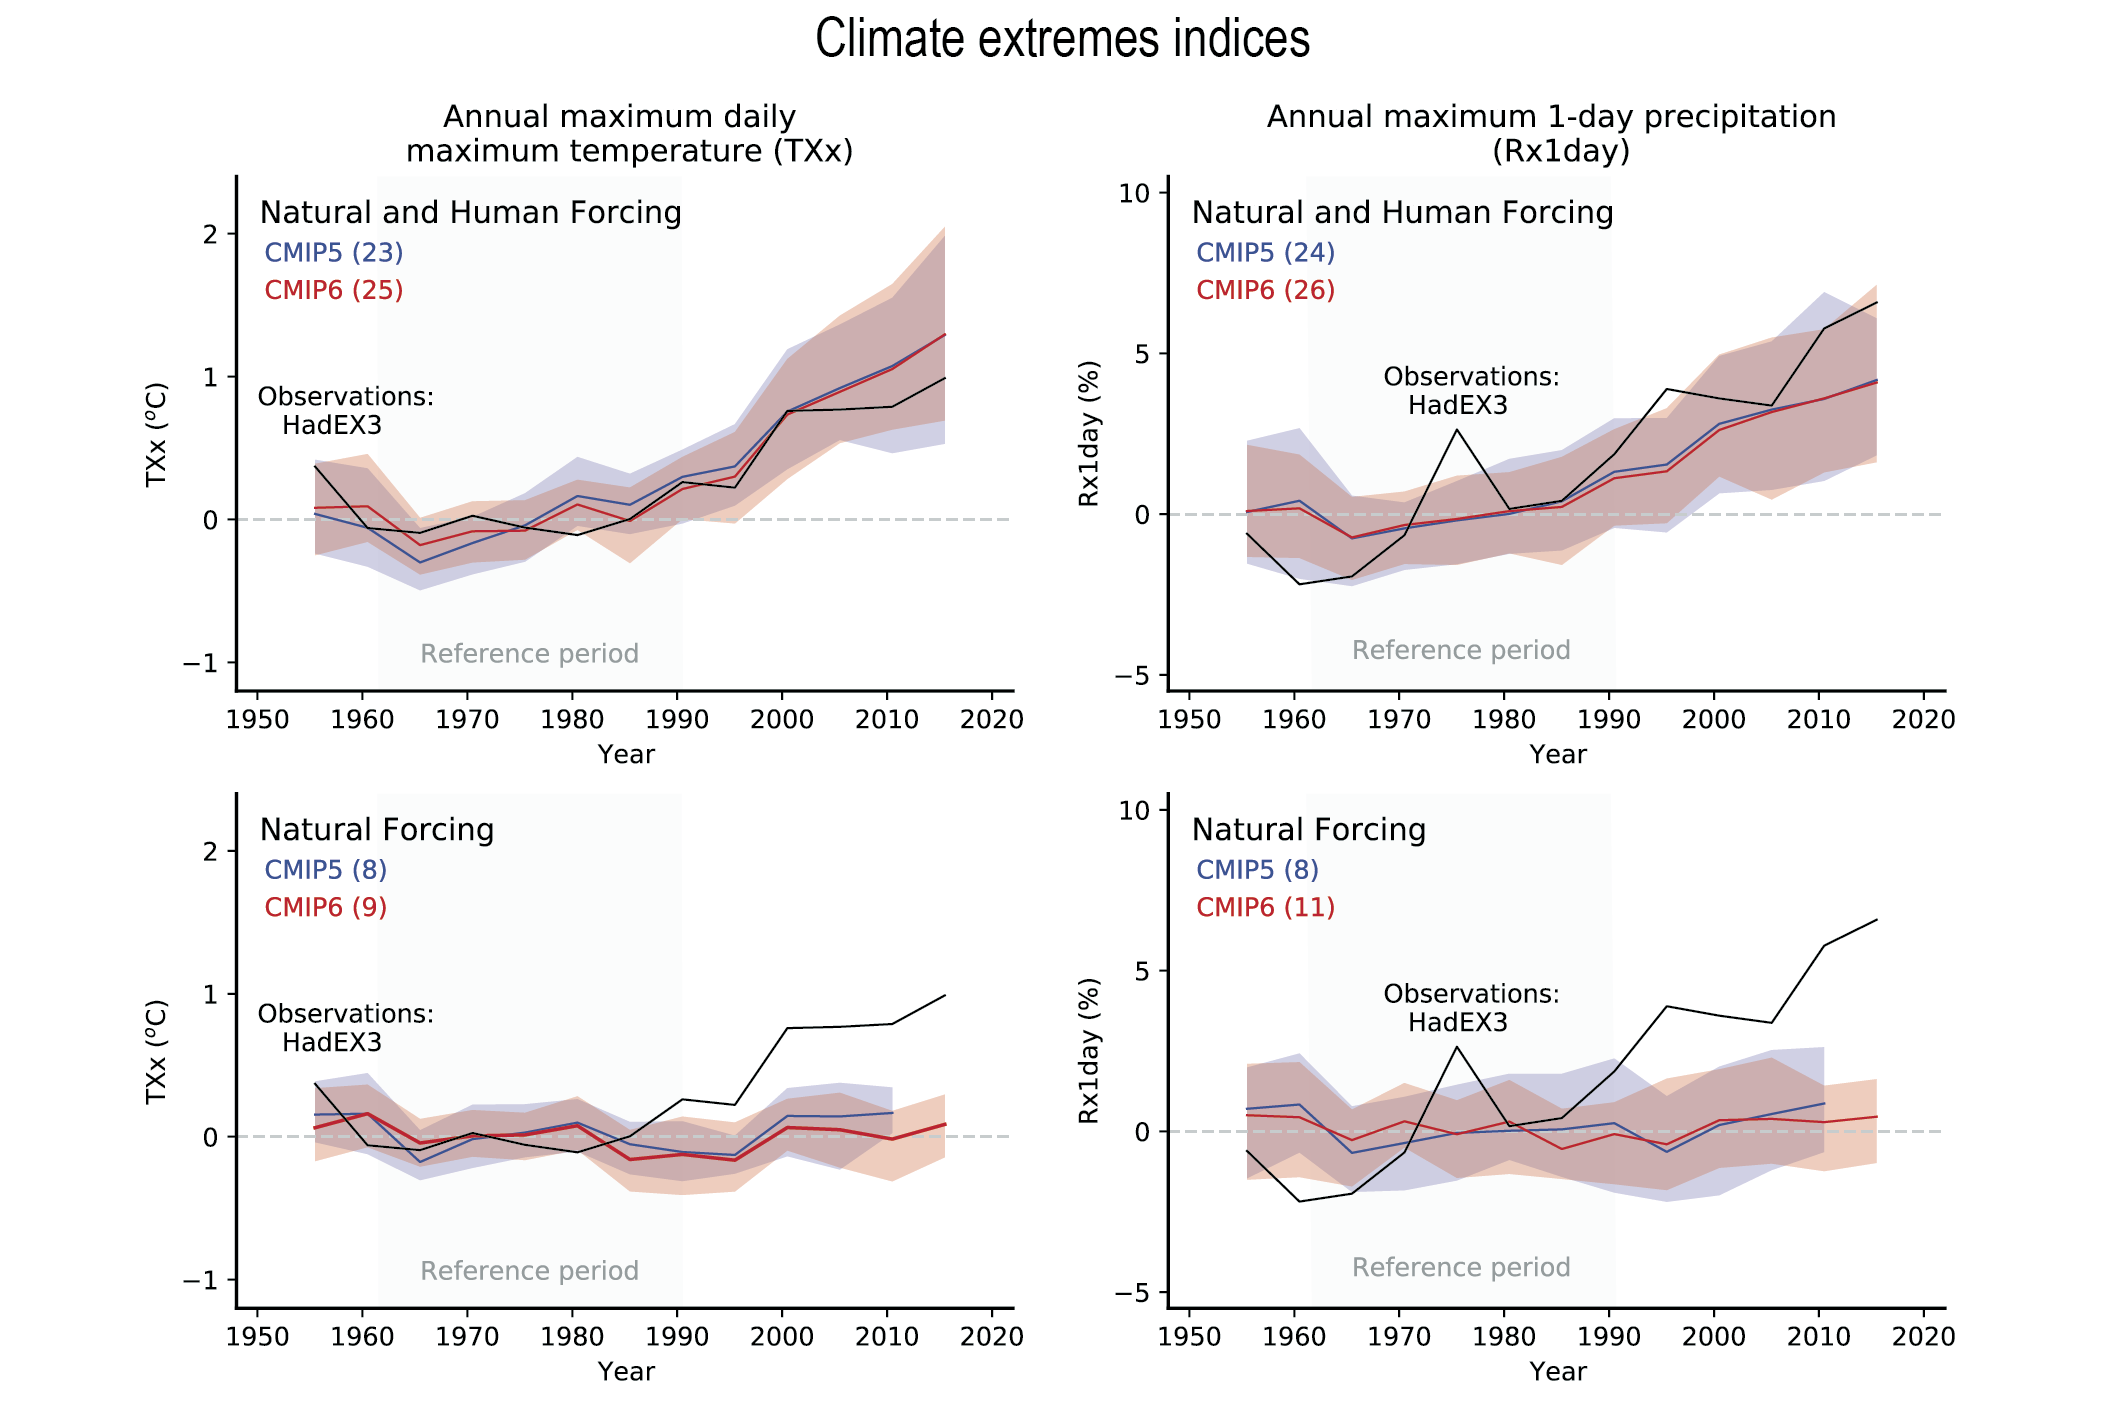
Figure caption
Cross-Chapter Box 3.2, Figure 1 | Comparison of observed and simulated changes in global mean temperature and precipitation extremes. Time series of globally averaged five-year mean anomalies of the annual maximum daily maximum temperature (TXx in °C) and annual maximum 1-day precipitation (Rx1day as standardized probability index in %) between 1953 and 2017 from the HadEX3 observations and the CMIP5 and CMIP6 multi-model ensembles with natural and human forcing (top) and natural forcing only (bottom). For CMIP5, historical simulations for 1953–2005 are combined with corresponding RCP4.5 scenario runs for 2006–2017. For CMIP6, historical simulations for 1953–2014 are combined with SSP2-4.5 scenario simulations for 2015–2017. Numbers in brackets represent the number of models used. The time-fixed observational mask has been applied to model data throughout the whole period. Grid cells with more than 70% of data available between 1953 and 2017 plus data for at least three years between 2013 and 2017 are used. Coloured lines indicate multi-model means, while shading represents 5th–95th percentile ranges, based on all available ensemble members with equal weight given to each model (Section 3.2). Anomalies are relative to 1961–1990 means. Figure is updated from Seong et al. (2021), their Figure 3 and Paik et al. (2020b), their Figure 3. Further details on data sources and processing are available in the chapter data table (Table 3.SM.1).